_______________
Hey Jack! ")
The legends goes something like this... once there was a Trader who felt he could teach anyone how to Trade profitably. He collected a few average folks and guided them and after some time... they went on to make over 400 million dollars. He named these Traders the Turtles.
The Turtle method is essentially this:
Buy a 20 day high and Sell a 20 day low. You are always in the market. It captures the big trends and those pay for the plethora of losing Trades.
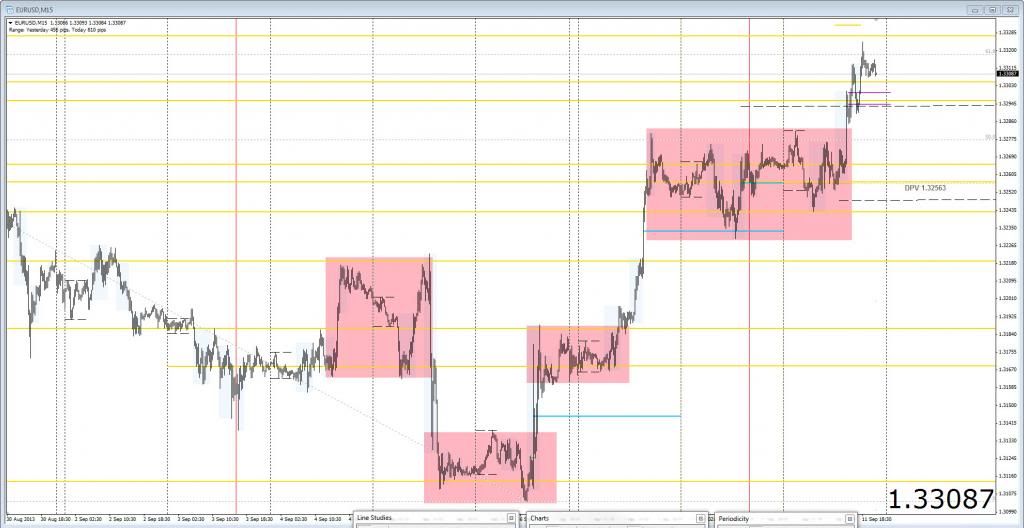
The book titled: Street Smarts by Linda Raschke and Larry Connors details a short term Trading pattern they dubbed the Turtle Soup... as it turns out 20 period [pick any timeframe] breakouts generally produce many false breakouts.
Hence... the Turtle is cooked in his/her "Soup". I love this pattern and consistent winner in my Black Book of Munitions.
Examples you ask... why certainly...