You are using an out of date browser. It may not display this or other websites correctly.
You should upgrade or use an alternative browser.
You should upgrade or use an alternative browser.
Scout Sniper Basic Field Guide - InnerCircleTrader
- Thread starter TheInnerCircleTrader
- Start date

Re: ICT OTE concepts chart added
Very clean and readable chart, nice.")
(IIRC, Tansen is still holding some EUR shorts based on that OTE SS NY level we just had. He scaled out a little though. It was a good setup and followed through well.)
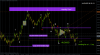
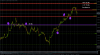
GdayFx said:In this chart i have shown the OTE levels, please take note of the 0 - 100 fib levels in each session then the OTE
Very clean and readable chart, nice.
(IIRC, Tansen is still holding some EUR shorts based on that OTE SS NY level we just had. He scaled out a little though. It was a good setup and followed through well.)
piptech said:Sybrand,thanks again for all your assistance on cot data,plse allow me to ask how you digest the info and determine when commercials are long/short on a particular currency verses another and the amount,thanks again for using your valuable time to assist,
To be honest, you do not have to see things as clear as they are. I have read Larry Williams' book: Trade Stocks and Commodities With the Insiders BUT ICT's video on COT data hasn't been matched in that book. I am currently busy reading a book by Stephen Briese: Commitment of Traders Bible and there might be additional info on incorporating the large traders' positions into determining how price may move. If any of the additional things are relevant to the forex futures market is another question. As the book defines that seasonal trends may have a bigger impact in trading futures contracts for something that does in fact (In the real world hahaha) work in seasons like for example corn. I still have to look and see at what he teaches and if there is any consistent link between that and the forex market.
I have a question about trading forex and what kind of fills we can expect to get? I'm making the switch over from trading the 6e and ES to the Eur/USD, etc in Forex land.
I've had a few trades where I set up the trade and come back a couple hrs later and for some reason didn't get filled. I'm thinking it might have something to do with the spreads? Do the spreads differ from vendor to vendor? And if so, do you guys have a formula you use to give yourself the best shot to get into a trade without risking too much?
Anyways, i'm asking these questions and i'm +2100 pips in my account.... so not too shabby. Just trying to understand forex land a bit better.
thanks,
dougl
dougl1965 said:I have a question about trading forex and what kind of fills we can expect to get? I'm making the switch over from trading the 6e and ES to the Eur/USD, etc in Forex land.
I've had a few trades where I set up the trade and come back a couple hrs later and for some reason didn't get filled. I'm thinking it might have something to do with the spreads? Do the spreads differ from vendor to vendor? And if so, do you guys have a formula you use to give yourself the best shot to get into a trade without risking too much?
Anyways, i'm asking these questions and i'm +2100 pips in my account.... so not too shabby. Just trying to understand forex land a bit better.
thanks,
dougl
Less your doing something like 800 lots Oanda's always been pretty good to me and there are some dodgy brokers who will give you the slippage you expect to see but TYPICALLY if your broker is good you wouldn't get any slippage. Sometimes you may even get high tick or low tick.
Tansen,
So if you draw a fib and take an entry at 79% retracement, you typically don't have problems getting filled? That's good news if thats the case? I'm still on demo and been using FXDD. When I start, it will be with a small amount of money.
I'm like everybody else, looking forward to ICT's videos. Right now I'm keep it simple; draw my higher timeframe support/resistance levels; try to gage direction; check the dollar to see if its running into resistance/support on its higher timeframes; etc. I'm doing pretty good. I need to work on ways to cut back on my risk. I tend to use higher stops than ICT likes to. I'll check Oanda out again.
Anyways, thanks for chiming in!
dougl
dougl1965 said:Tansen,
So if you draw a fib and take an entry at 79% retracement, you typically don't have problems getting filled? That's good news if thats the case? I'm still on demo and been using FXDD. When I start, it will be with a small amount of money.
I'm like everybody else, looking forward to ICT's videos. Right now I'm keep it simple; draw my higher timeframe support/resistance levels; try to gage direction; check the dollar to see if its running into resistance/support on its higher timeframes; etc. I'm doing pretty good. I need to work on ways to cut back on my risk. I tend to use higher stops than ICT likes to. I'll check Oanda out again.
Anyways, thanks for chiming in!
dougl
I pretty much only use the 79 for entries, there's the odd time where it'll miss it by 0.1 pip but I've gotten in shorts where I was high ticked in by that much as well and gotten filled even though it didn't reach there.
Re: Lesson - Scout Sniper Basic Field Guide - InnerCircleTrader
Lesson
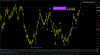
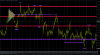
So i was setting up this GBPCHF chart, on this fine Saturday morning in Australia, and found something interesting along the lines of what ICT preaches all the time "confluence" my friends. If you take any chart on MT4, set it to weekly chart and hit "Ctrl Y" on key board, this will give you your year start to end lines, and Daily chart will give monthly lines. So then you place your yearly and monthly highs and lows on the chart. Drop down to a smaller time frame and look at price action around those levels, also using fibs off the highs and lows to determine price action levels, have a look at the pair chart i added, and you can see there have been trading ops just on this pair alone in the last 3 weeks. note to gbpchf using this years high & low for fib levels confluence with HTF 50 fib level. When price hit that confluence area, it then sold off 700 pips so im not sure it will hit it again, but you never know. The lesson is about the price action on the way back to the confluence area. Dan
Lesson
So i was setting up this GBPCHF chart, on this fine Saturday morning in Australia, and found something interesting along the lines of what ICT preaches all the time "confluence" my friends. If you take any chart on MT4, set it to weekly chart and hit "Ctrl Y" on key board, this will give you your year start to end lines, and Daily chart will give monthly lines. So then you place your yearly and monthly highs and lows on the chart. Drop down to a smaller time frame and look at price action around those levels, also using fibs off the highs and lows to determine price action levels, have a look at the pair chart i added, and you can see there have been trading ops just on this pair alone in the last 3 weeks. note to gbpchf using this years high & low for fib levels confluence with HTF 50 fib level. When price hit that confluence area, it then sold off 700 pips so im not sure it will hit it again, but you never know. The lesson is about the price action on the way back to the confluence area. Dan
Attachments
P
Piper
Guest
Wonder what happened to the vid. Did anyone heard something?
Did anyone heard something?
P
Piper
Guest
Re: Lesson - Scout Sniper Basic Field Guide - InnerCircleTrader
Some very nice idea for getting ranges,definitely going to test it out!
Tnx mate!
BTW u got a cool site running there!
Cheers,
Piper
GdayFx said:Lesson
So i was setting up this GBPCHF chart, on this fine Saturday morning in Australia, and found something interesting along the lines of what ICT preaches all the time "confluence" my friends. If you take any chart on MT4, set it to weekly chart and hit "Ctrl Y" on key board, this will give you your year start to end lines, and Daily chart will give monthly lines. So then you place your yearly and monthly highs and lows on the chart. Drop down to a smaller time frame and look at price action around those levels, also using fibs off the highs and lows to determine price action levels, have a look at the pair chart i added, and you can see there have been trading ops just on this pair alone in the last 3 weeks. note to gbpchf using this years high & low for fib levels confluence with HTF 50 fib level. When price hit that confluence area, it then sold off 700 pips so im not sure it will hit it again, but you never know. The lesson is about the price action on the way back to the confluence area. Dan
Some very nice idea for getting ranges,definitely going to test it out!
Tnx mate!
BTW u got a cool site running there!
Cheers,
Piper
Piper said:Wonder what happened to the vid.
Not sure, ICT had this on his twitter from a few days ago:
Episode 3 link will tweet automatically upon Youtube servers processing completes.
But no updates since and still waiting on it. Perhaps he hit a snag and had to redo something. No matter, it's usually worth the wait given the amount of effort he puts into the vids.
Donnald_Darvy
Member
dougl1965 said:Anyways, i'm asking these questions and i'm +2100 pips in my account.... so not too shabby. Just trying to understand forex land a bit better.
thanks,
dougl
Nice!! ~~ sounds like you understand it plenty
Re: NZDUSD confluence in HTF LTF fibs
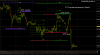
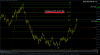
I am not saying trade this, i'm just putting it out there, that there could be a reaction at these levels, wait until it sorts it self out after the fact, if it reaches the confluence area. The long term outlook, looks bearish
I am not saying trade this, i'm just putting it out there, that there could be a reaction at these levels, wait until it sorts it self out after the fact, if it reaches the confluence area.
The long term outlook, looks bearishAttachments
Donnald_Darvy said:Nice!! ~~ sounds like you understand it plenty
Thanks! I have a lot of work to do but definitely liking the results!
dougl
Good morning from Canada eh. FIRST POST
Just signed up last week and have been catching up on videos and analyzing charts. I have been at forex since 2009 with little success until lately. I gave up all the bull I had learned from so called "forex guru's" and started looking at the charts differently. I found that not following the herd I was starting to succeed, but I still wasn't sure why. I stumbled across Michael Huddleston and ICT while searching for some answers. I am so grateful to Michael for taking the time to pay it forward and teach anyone who is willing to put in the time and effort that is required to succeed. Thank You Michael.
And for all you noobys out there "PATIENCE"
Slow and steady wins the race
FIRST POSTJust signed up last week and have been catching up on videos and analyzing charts. I have been at forex since 2009 with little success until lately. I gave up all the bull I had learned from so called "forex guru's" and started looking at the charts differently. I found that not following the herd I was starting to succeed, but I still wasn't sure why. I stumbled across Michael Huddleston and ICT while searching for some answers. I am so grateful to Michael for taking the time to pay it forward and teach anyone who is willing to put in the time and effort that is required to succeed. Thank You Michael.
And for all you noobys out there "PATIENCE"
Slow and steady wins the race
Good morning!
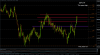
Did anybody catch any of the 1000 pip move this morning in EurUsd?
Honestly, I had the long trade setup at around the 70.5 fib level. I watched 20 minutes of ICT's new video (talking about a down move and got psyched out (even on demo). But it obviously worked.
I drew the fib from my 1 hr support line below (1.31628) up to the London Open high (around 7 GMT).
I know skype has been discussed for being a sounding board on our ICT trades. I'm definitely for that in some fashion.
Have a good day!
dougl