Supply And Demand

FTMO Trader Scouting
On the issue of building up a technical view based on multiple sources, take a look at this 45 minutes webinar. It is just traditional TA but from what I've read there are a few members who might get something from it. (I don't mean to undermine your thread Piper - you can see areas of supply and demand on his charts too! ;) )

https://www.youtube.com/watch?v=-hcng-z8REM

...and for those without the 45 minutes, here's a summary.

Bw7Mllf.jpg
 
AusDoc said:
I'm not sure what all the fuss is about. Can it be merely language? Supply and demand and resistance and support are pretty much the same concepts, looked at in only slightly different ways.

No, Im sorry I dont accept that theyre the same concepts, they are distinctive, and with good reason as Ill try to explain.

Supply and demand as a concept may well exist in the market, which is why I referred to it as a half truth, and not an complete lie.

However, in context of Sam Seiden's teachings, it is a half truth, why?

Because orders stack above and below prior highs and lows, not just at 'reaction levels' as shown in Sams webinars.

Therefore, if we merely accept Sams "high probability levels" we are limiting ourselves to essentially one side of the market and by default, reducing our probability by 50%.

The key is to understand when an 'orderblock' will provide liquidity and when a 'stop run' will provide liquidity.

Would the reflection pattern work if we were only looking for orders stacked at prior reaction levels?

Is supply and demand completely defunct? No, its a concept that can describe why price reacted to a level, but AFTER THE FACT!

Not only is it after the fact analysis but its only half the story...
 
G'Day foreigner :)

I have not watched the 3 videos that Piper posted and I don't know Sam's understanding in detail so I can't comment on that. But Sam didn't invent the terms or the concepts so I am just using them in their generic sense.

When a whole bunch of buy orders hit the market, they constitute demand. They can and do execute at any price level subject to what the buyer wants and what liquidity (supply) is available. Equally, when a whole bunch of sell orders hit the market, they constitute supply. They can and do execute at any price level subject to what the seller wants and what liquidity (demand) is available. This is just how markets work, nothing special. Supply and demand, selling and buying: basic economics concepts, nothing more.

After that it becomes psychology. Traders have intentions, memory and perceptual skills. Though some may be offended at the thought, the fact is they are creatures of habit. They are aware of other parties and competing interests. They will use their knowledge and skills to attempt to achieve their trading objectives. I am talking about all smart traders here, from big banks to Billy down the street. The whole thing works somewhat coherently because of a single assumption that is generally valid - people trade with their own best interest at heart (that is, people trade to win or to profit).

Given the history (market memory), habits and beliefs about other traders there tends to be a degree of patterning to the trade prices (or price action if you like). We see this displayed in pivots, trends, support and resistance levels, and so on. This has a tendency to set up levels or zones at which buyers and sellers will have a greater tendency to transact. A classic observation of this would be what has become known as institutional and psychological levels.

So normal market dynamics sets up a situation where particular price levels will have a tendency to become dominated by supply, dominated by demand, or somewhere the battle can rage while so-called bulls and bears can each push to see who wins. When traders look at charts the signs are there, made clearer perhaps by drawing lines and rectangles to highlight what has happened. Hence, the chart tells a story of supply and demand and reveals levels of support and resistance.

It is therefore quite true to say of supply and demand, as you have, that:

its a concept that can describe why price reacted to a level, but AFTER THE FACT!

That is equally true of support and resistance levels. They are created by price history. In both cases however, we can use the price history as a source of intelligence in drawing up our own trading plan of attack.

The markets are very dynamic. Orders come and go at an astonishing rate. Orders are placed and pulled all the time. Even if we had a central exchange for spot fx and could access a genuine depth of market tool we would probably still not be able to see effective levels of support and resistance or zones of demand and supply any better than we already can anticipate them using our regular methods.

So at the end of the day I think it is moot. Call the levels anything you like, it does not matter. But given the generic way I use the concepts of supply and demand I can't see that there is any point to debate and we are in agreement.

I haven't seen the videos but when you say:

orders stack above and below prior highs and lows, not just at 'reaction levels' as shown in Sams webinars.

...could it be that he refers to a tendency for a greater number of orders to congregate at predictable levels? If so, I can't see any problem with that. It is consistent with what I described above. So long as he doesn't make the ridiculous claim that orders can only be found there, which clearly he wouldn't, surely. Anyway, any support or resistance level on a chart is a 'reaction level'.

Perhaps you could clarify the following sometime.

The key is to understand when an 'orderblock' will provide liquidity and when a 'stop run' will provide liquidity.

An orderblock strikes me as nothing more than a level or zone of supply or demand. Indeed, that's what it is by definition. Whether a market will successfully feed by returning to an orderblock or will blow through on what is interpreted as a stop run is an interesting question, every time. One can anticipate this based on many factors, such as distance away, momentum approaching the level, overall structure and likely directional bias, and so on. No one has a franchise on getting this prediction right. :)
 
Aus, I never liked the term supply and demand ever since it was used to describe my business by someone who had no clue about business.

The genius in question, lets call him as 'bob the builder' used the term as if it was the reason my business was successful.

Clearly supply demand was not the reason my business was successful, its merely a concept to describe whats happened historically.

So those that think applying supply demand theory to trading will make them successful or consistent I think are deluded.

I find it a very weak method of describing a business model and no different in trading the markets.

Furthermore, Ive watched most of Sam's free material and its clear that attention was only being drawn to previous reaction levels. Thats my issue, and why I think its flawed thinking to rely on historic "supply demand" levels only when supply or demand is found above and below where price reacted historically.

Youre right it is down to terminology but thats where I think many of us get caught out.
 
Locate and Quantify

Let's simplify things and see where it gets us:

Demand = Buy orders
Supply = Sell orders

anybody that puts in a buy order (@MKT or LMT) is creating demand. anybody that puts in a sell order is creating supply.

So to say you analyze Supply&Demand is like saying you analyze Sell&Buy orders...

Which I think...
is what everyone is trying to do anyway, hahaha!

The real trick is to have tools/concepts/beliefs that help you LOCATE and predict those Sell&Buy orders, and to some extent, quantify them as well.
 
AusDoc said:
On the issue of building up a technical view based on multiple sources, take a look at this 45 minutes webinar. It is just traditional TA but from what I've read there are a few members who might get something from it. (I don't mean to undermine your thread Piper - you can see areas of supply and demand on his charts too! ;) )

https://www.youtube.com/watch?v=-hcng-z8REM

...and for those without the 45 minutes, here's a summary.

Bw7Mllf.jpg

I normally don't like "TA" videos and such coming from brokers (they tend to be junk more often than not,) but this one wasn't half bad.
 
Foreigner is right, to see the market as supply and demand is idealistic, it is how it should be, but live in the real business world and one soon realizes it's far from how it is.

I studied Sam a long time ago . The notion of S&D made sense, the idea that price was 'engineered' (Sam's words) to return to catch the missed orders is exactly the same as Chris Lori and his analysis of price reversal - I forget his terminology, but the idea is the same - these make real world sense. (actually the same as ICT's OTE)

Why is it that a gap should get filled, Sneiden says that it is simple, on one side of his desk, a wooden holder, with a wire spike held the sell orders, on the other side were the buys.

Price shoots down through the sell orders, too fast (gap), so Sam could see these pieces of paper still sat on his desk, the buys got pulled so they were gone, all that sat were the sells.

Then price would slowly, magically, get pulled back to reach those sell orders, then his desk got cleared.

That is Sam Sneiden's supply and demand - makes a lot of sense.
 
Re: Locate and Quantify

the golden gun said:
The real trick is to have tools/concepts/beliefs that help you LOCATE and predict those Sell&Buy orders, and to some extent, quantify them as well.

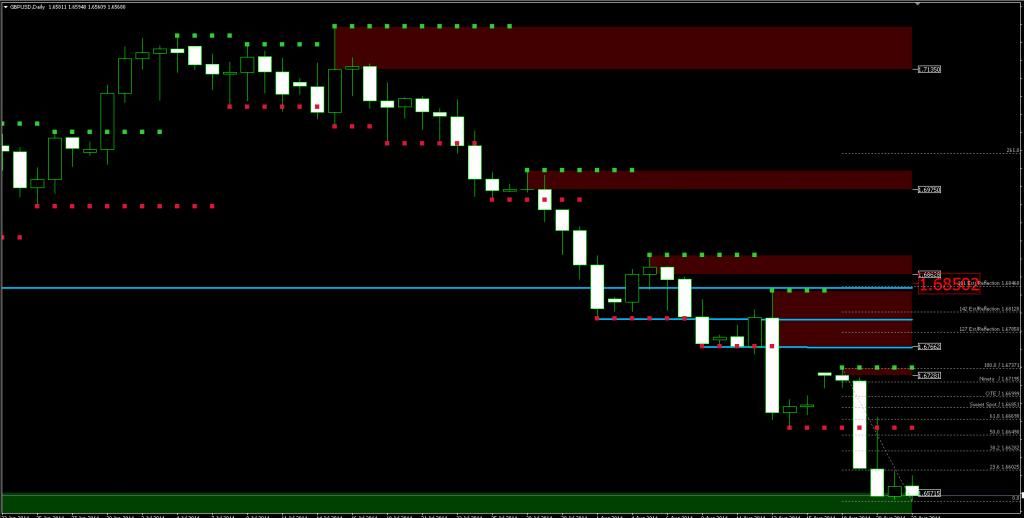
OK, try this one. It isn't my own, I just made it work in build 600+, fixed a bug and commented out some superfluous code and set my own defaults. The original concepts and coding are quite clever.

You need to watch it in RT for a while to appreciate it properly. I have never bothered with "weak" zones so can't comment on that functionality. As attached though, it will identify zones, modify their look when they are retouched to show this 'weakening' and remove them completely if they prove to be too minor and become exhausted or blown through. It has alerts that are useful and some other features like fibs between zones that I have not used (but when I took a quick look was not impressed - YMMV).

I have noticed that it sometimes identifies exactly the zones and levels that ICT refers to, including the ones he calls order blocks. In any event, though it may be a tad over the top in identifying zones, it is generally quite good at both locating the appropriate areas and changing to reflect updated price action. In general, like any tool or indicator, it isn't perfect but can be quite useful. How useful in this case probably depends not so much on the tool as the user.

I attach some images and the indicator. Maybe we can just put the terminology and any individual's interpretation and explanation aside and let the charts speak. :) Of course, it is always best to read a chart and be able to manually locate useful levels and patterns, but sometimes a tool such as this can prove educational.
 

Attachments

  • GBPUSDDaily-S&D-1.png
    GBPUSDDaily-S&D-1.png
    46.7 KB · Views: 100
  • GBPUSDDaily-S&D-2.png
    GBPUSDDaily-S&D-2.png
    45.5 KB · Views: 79
  • GBPUSDDaily-S&D-3.png
    GBPUSDDaily-S&D-3.png
    42.6 KB · Views: 73
  • GBPUSDDaily-S&D-4.png
    GBPUSDDaily-S&D-4.png
    42.3 KB · Views: 83
  • Supply-Demand-Zones-b600.mq4
    31.4 KB · Views: 76
Could be a useful tool for someone new to marking out the "combat zones"
I couldn't get it to work personally, but I'm not very MT4 savvy, so I'm not blaming you.

To me, this all boils down to the Motivations of the Market Makers.

I think they have 2 Main Objectives:
1. Run Stops
2. Preserve Market Structure


When they can do BOTH with one manipulated price move, I see that as a liquidity "hot spot" because it kills 2 birds with one stone (well more like 1 bear and 1 bull)

Ex. attached
 

Attachments

  • fiber_sell_aug18_2014.jpg
    fiber_sell_aug18_2014.jpg
    102.2 KB · Views: 95
Re: AusDoc Indicators Combined

AusDoc said:
The original concepts and coding are quite clever.

Looks interesting, Thanks for sharing. So, what are the "Supply Demand" zones based on? I see they dont necessarily correspond with ICTs ordeblock theory or Smidens supply demand levels.

I went ahead and combined the indicator with your Support Resistance/Stop locator for a more 'rounded view';)

The fat block above 6766 may be of interest, some nice confluences going on..

AudDocIndicatorconfluence_zpsd950de64.jpg
 
Re: AusDoc Indicators Combined

foreigner said:
... So, what are the "Supply Demand" zones based on?

The fat block above 6766 may be of interest, some nice confluences going on..

I was mainly referring to the coding approach actually. The basic identification of levels is pretty straight forward, pretty much just what you can see in the charts. I do like the way retouches are acknowledged though. If you think about ICT's means of identification of order blocks where he looks for the last bullish candle prior to a decline, for example, you can see the same logic used in these zones. The differences are that the zones are drawn from the right side of PA most of the time and in the last bullish move example, it may well be identified in a wick rather than in some prior candle, just as you see at the top of the chart you posted. The reasoning is quite legit too, since the wick represents the final push up by bullish orders before being overwhelmed by bearish orders, hence an order block.

I agree that a significant level rests right around where you have identified (the S&R and fib confluence). If you look further left you can see a level/zone that functioned as a prior point of control or an old balance point. It will be a level to keep in mind at some time in the future. With any luck the zones tool may serve to remind us.

eDZVlHq.png
 
the golden gun said:
I couldn't get it to work personally, but I'm not very MT4 savvy

No worries. For anyone who may need it, the procedure to install an indicator in uncompiled format (i.e. file ends in .mq4) is as follows on a PC:

1. In MT4 go to File > Open Data Folder An explorer window opens.
2. Click to the MQL4 folder and then the Indicators folder Drop the file into here.

Now there are two ways to proceed.

1. If you don't need MT4 to be running, just exit from the application and then restart it. When MT4 starts it automatically tries to compile any uncompiled files in the indicators folder so this should make it available to use from your list of indicators.

2. If you prefer to keep MT4 running, just open your MetaEditor application, find the uncompiled file in the file list and double-click it to open it in the editor. Once it's there just click the Compile button. Once it is compiled it will immediately be available to use from the file list in MT4.
 
There are some pretty useful resources available for getting the most from supply and demand.

This forexfactory thread has a good intro:
http://www.forexfactory.com/showthread.php?t=428204
Including this cool graphic:
http://www.forexfactory.com/attachment.php?attachmentid=1447280&d=1402652572
The thread starter moved on to his own site which is paid, but also offers plenty for free:
http://www.set-and-forget.com/supply_demand_beginners
Have a browse and watch a video or two to make your own mind up concerning its value.

There are also 3 posts of briefer, quite simple and sound info here:
http://instaforexpips.com/simplicity-supply-demand-trading-strategy/ [links to next 2 articles at bottom]
The author of this series appears to be the origin of the indicator I shared above. You can download the original version and a couple of pdf ebooks from within those posts. The ebooks are worth a look, especially some of the chart graphics with markup. I won't post them here because if you're interested you should go to the above links, and if you're not, there's no need!
 
Demand No Supply and Demand

Sorry to rain on the parade again guys but I just wanted to point out a couple of things for those open to reason and evidence.

My contention is that not only is the term supply and demand incorrect when used in this context but misleading to other members who may be led to believe that the market is subject to the laws of supply and demand at least in its traditional sense.

To put this in context, a traditional town market is somewhere you would find the laws of supply and demand. The producer supplies what the customer demands in about equal measure, excess supply is kept to a minimum and demand limited to what is usually consumed within a week or so.

Now lets take Wallmart, they flood the market with cheap Chinese goods and produce purchased with banker backed bucks, not profits. This is intended to control the market in the same way the FX market is controlled. From the supply side.

Thats right, I dont think that wallmart uses its profits to buy produce any more than the Governments use our Taxes to build roads.

These corporate fictions have little or nothing to do with supply and demand, they seek to control, manipulate and profit, by creating the impression of a free market, sound familiar?

Market Makers accumulate, manipulate and then profit release, how is that supply and demand?

If anything, It is beliefs that exists at a given price level not the supply demand Phenomenon. Who these beliefs belong to and what impact they have on the market better describes why price reacts in my opinion.

Sure, business is transacted at these levels but to say this is a supply demand imbalance I think is short sighted.

We are naive to believe that markets merely react to the laws of supply and demand so why are we coining the phrase when it couldnt be further from the truth?

Is supply and demand the reason price moves? No, its a popular term used to hide the fact the game is rigged, so why are we using it, becuase Sam Sieden Says So?..

Your feedback is welcome.
 
Oh Piper, you have nothing to prove.... don't take it so personally :-* LOL

I don't think this is raining on any parade. I agree with foreigner that the game is rigged and I know Piper knows that too. I wonder if this could be a simple confusion of cause with effect. So effectively the apparent disagreement is caused by approaching this at different levels.

That's quite understandable when you examine the definition of terms from a simple economics perspective. It doesn't hurt to be skeptical and keep an awareness that the rigging can take any form at any time but this all seeks to understand underlying motivation at some level.

In reality, when looking at a chart, whatever the real, underlying, assumed, imagined or otherwise derived interpretation of another party's motivation or intention, at any particular point on the chart we have nothing more than matched orders. So on a chart, we see actual supply and demand meeting. At this level it is literally just the documentation of met supply and demand.

At a different level we get into interpretation. That's where it can become a proverbial can of worms. Some of that interpretation and implied trading responses will be more successful than others. This is an area where open discussion, willingness to learn, and evaluation of results all does indeed become valid and it presents real opportunities for developing useful insights.

So I welcome your input foreigner. You make some valid points about the operation of markets. Maybe if you can hold onto that awareness as background (or consideration of market participants possible motivations for particular moves) and then just focus on what the charts actually document it may help.

This reminds me of the principle of trading what you see, not what you think should happen or fear will happen. We have to deal with the supply and demand (or, more neutrally perhaps, the price action) and beyond that, keep things very, very simple. Otherwise, all manner of interpretation and beliefs will mess with your mind. >:D
 
Piper, foreigner was making an important semantics point. You responded with nothing but sarcasm.

Though I do want to congratulate you on quitting your day job! That's a pretty big achievement. Considering your posting history, I'm guessing somewhere in the Spring?

I'm also glad your friend, a consummate insider, was able to teach you. However, your posting has become rather aggressive, making interaction not highly desirable. I also would worry that the ego & money will cause you great harm. Be mindful of how your interactions have changed.
 
Re: Demand No Supply and Demand

Since feedback was genuinely invited I just want to try to be as clear as possible about my point above, so hopefully this helps.

foreigner said:
My contention is that not only is the term supply and demand incorrect when used in this context but misleading to other members who may be led to believe that the market is subject to the laws of supply and demand at least in its traditional sense.

The law of supply and demand is pretty simple. It just says that when supply exceeds demand price will fall and when demand exceeds supply, price will rise. It is a description of what happens and in that sense explains a phenomenon, but it doesn't explain why one or the other necessarily overbalances the other at any point in time, just that when it overbalances, what will happen.

foreigner said:
To put this in context, a traditional town market is somewhere you would find the laws of supply and demand. The producer supplies what the customer demands in about equal measure, excess supply is kept to a minimum and demand limited to what is usually consumed within a week or so.

Now lets take Wallmart, they flood the market with cheap Chinese goods and produce purchased with banker backed bucks, not profits. This is intended to control the market in the same way the FX market is controlled. From the supply side.

Thats right, I dont think that wallmart uses its profits to buy produce any more than the Governments use our Taxes to build roads.

These corporate fictions have little or nothing to do with supply and demand, they seek to control, manipulate and profit, by creating the impression of a free market, sound familiar?

All the above may be fine but it is interpretation of things that go well beyond supply and demand. In that sense, even if 100% correct, it confuses the issue.

foreigner said:
Market Makers accumulate, manipulate and then profit release, how is that supply and demand?

How is it anything but supply and demand when you see it on a chart? You are describing normal market dynamics. For whatever reasons accumulation, manipulation and profit release happen, they don't change the law of supply and demand. The law of S&D does not impute or imply motivation beyond people wanting to buy as low as possible and sell as high as possible.

foreigner said:
If anything, It is beliefs that exists at a given price level not the supply demand Phenomenon. Who these beliefs belong to and what impact they have on the market better describes why price reacts in my opinion.

Yes, this illustrates the confusion of ideas. You are right, of course, it does very much come down to beliefs or opinions attached to price levels and it does matter just who holds and acts on them. While that is completely correct, it does not have any baring on supply and demand as concepts; that is merely the sum total of all of that expressed in the actual market commitment of buying and selling.

foreigner said:
Sure, business is transacted at these levels but to say this is a supply demand imbalance I think is short sighted.

No, it's an accurate description. That's what markets do. It would be short sighted to claim that S&D fully explains the reasons why supply or demand overbalances at any particular place but the law of S&D makes no claim to do so.

foreigner said:
We are naive to believe that markets merely react to the laws of supply and demand so why are we coining the phrase when it couldnt be further from the truth?

Is supply and demand the reason price moves?

I think I've answered this above. The point is that using an understanding of supply and demand (or the close cousin concepts of resistance and support) we can approach the charts with a little less passion and can hopefully be a bit clearer headed and less vulnerable to the tendency to be forever trying to second guess some imagined motivation by "the market." It is a way to describe or summarise and some associated tools can prove quite effective.

Supply and demand may be different things to different people but if we forget about how it is dressed up by those who want to market something and focus instead on what it really is then it can help in chart analysis. So when a move down occurs and a supply zone is identified we can note that. Who pushed it down? Why did they do it? Who cares? You have to trade that it happened, not why it happened.

Hope this helps :)
 
sqa said:
Piper, foreigner was making an important semantics point. You responded with nothing but sarcasm.

Though I do want to congratulate you on quitting your day job! That's a pretty big achievement. Considering your posting history, I'm guessing somewhere in the Spring?

I'm also glad your friend, a consummate insider, was able to teach you. However, your posting has become rather aggressive, making interaction not highly desirable. I also would worry that the ego & money will cause you great harm. Be mindful of how your interactions have changed.

100% right. Ahm...i can only say "Don't drink and post stupid s***." :) I have my weak moments sometimes.
Apologies, for the above post ,no personal harm meant. Sorry F-man. :p
 
Piper said:
100% right. Ahm...i can only say "Don't drink and post stupid s***." :) I have my weak moments sometimes.
Apologies, for the above post ,no personal harm meant.

I recommend not drinking at all, especially when the market is OPEN! Gotta keep that brain machine sharp ;)
 
FTMO Trader Scouting
Back
Top