Hi Booze007,
I might be entirely wrong on this and only drew in the crosses to quickly check if we are on the same page.
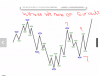
If price turns here and we can mark the red circle with a green cross the green cross with the arrow pointing towards it will turn blue. If the green cross close to 1.32 is then broken, that is where market structure is broken.
If 1.34 is broken the cross remains green and thus market structure remains in tact.
Also even if any high is broken it is likely to retrace before it continues up or it might take out stops there before it goes down longer term. That is why we see what happens to the previous green cross at the bottom.
You can break this down (or scale it up for that matter) to any time frame. The easiest thing would be to start with the COT data....
http://www.barchart.com/chart.php?sym=DXU13&style=technical&template=&p=WN&d=L&sd=&ed=&size=M&log=0&t=CANDLE&v=1&g=1&evnt=1&late=1&o1=&o2=&o3=&sh=100&indicators=COTLC%2813369344%2C26112%2C153%29&chartindicator_1_code=COTLC&chartindicator_1_param_0=13369344&chartindicator_1_param_1=26112&chartindicator_1_param_2=153&addindicator=&submitted=1&fpage=&txtDate=
http://www.barchart.com/chart.php?sym=e6U13&style=technical&template=&p=WN&d=L&sd=&ed=&size=M&log=0&t=CANDLE&v=1&g=1&evnt=1&late=1&o1=&o2=&o3=&sh=100&indicators=COTLC%2813369344%2C26112%2C153%29&chartindicator_2_code=COTLC&chartindicator_2_param_0=13369344&chartindicator_2_param_1=26112&chartindicator_2_param_2=153&addindicator=&submitted=1&fpage=&txtDate=
We are approaching a rather net short position with the commercials in the COT data but it isn't a drastic drop yet or net short yet. The USD had a decent rise in commercial net long positions though. So we might see a turn around in price not too long from now. I would have liked to see more of a drop or a drop into a net short position below the one we had in June, to start selling just yet.
Also look at the seasonal chart, that helps some times just to get the direction right and can work well paired with the COT data. You will not always get the extent of the move but it can help and is another tool we can check to see if things are in fact aligning with each other in our favor.
http://www.seasonalcharts.com/classics_eurusd.html
Looks like it can top out this time of the year/month and come down before a huge rally from middle September to the end of the year.
My 2cents: Seasonally we are expecting a small drop in price. The commercials are close to being net short. We are trading close to a high where long term stops might be trailing at. Lets see if they take out those stops and then start selling. We can however include the idea of starting to sell now since there was a decent increase in the commercial's long positions, in the USDx, although I would have liked to see that as confirmation rather than basing my trade on it. I'm also still learning and just a student so this thing might go up to 1.37 without a drop. Please don't take to heart anything I say without "seeing" it yourself. Short and sweet of it, the COT data didn't pan out as clear as I hoped it would and that brings some caution to my decision. Lets see what the other guys has to say about next week
")
All the best,
Sybrand