ams_trades
Active Member
... or maybe not. I'm not so sure now! ???
walshman said:I would be interested :cheers:
ams_trades said:Another Aussie here that would be very interestedbnj:
dougl1965 said:I'm interested, especially if you have been able to see trades on other pairs? I'd really like to get a small group of us together and bounce trade ideas off each other? I know nothing is perfect but if a few people are looking for setups then the 5 star setups won't pass us by. It could be skype or something similar?
I live in the USA but work a day job, so seeing setups elsewhere does appeal to me.
I'm waking up in the middle of the night so not sure how long that will last? haha.
I had a good week though. I'm in the black again...doing it ICT micro style!
dougl
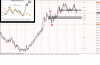
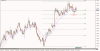
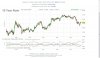
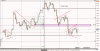
GdayFx said:Pop Quiz!!!, taken from ICT Ep 4 concepts, What are the Green shades representing? and the Red shades? in this H4 chart
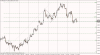
Al tough on the ones after i don't really get the triangle stuff(i'm digged more into divergence and s/r ) Could you explain on those a bit?GdayFx said:can any of you yield junkies put a directional bias on this? it could tank even further
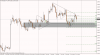
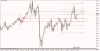
GdayFx said:EURUSD - Along with order flow blocks, triangle consolidations act as future support and resistance points, sometimes going beyond the point of reaction, then returning to apply an OTE from a fib point taken from a session high and low, i think i said that right
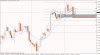
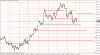
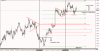
Correct me if i am wrong, but these are kill zones on the M15 chart right? i used an inverted fib on Daily chart points, and Boom! look at the price reactions! this is exactly what Michael is teaching us yeh, with a bit of chili on top!
Do you guys use price alerts? if you set up a high time frame chart with a price level alert, then ding ding your alert goes off, you go to your chart, check what time it is! then say to your self, is it time to pull the trigger?
GdayFx said:Pop Quiz!!!, taken from ICT Ep 4 concepts, What are the Green shades representing? and the Red shades? in this H4 chart
Skipper said:GdayFx what service you are using to get your yields? Look more clear than the others I have trying to find.
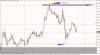
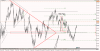
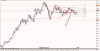
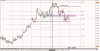
I am attempting to read your chart but am a bit confused ??? Are you pointing to a break of the support line down to the 1.33 area or drive higher? :hairpull:GdayFx said:EURUSD - new week support or resistance
walshman said:I am attempting to read your chart but am a bit confused ??? Are you pointing to a break of the support line down to the 1.33 area or drive higher? :hairpull: