Scout Sniper Basic Field Guide - InnerCircleTrader

FTMO Trader Scouting
It's actually good to leave this up so people can see what's being taught here is an analysis method, not a strict rule trading system.

This is mentioned in the videos. It's also mentioned that you are going to end up deviating and using your own view of the markets to create some of your own setups. The main goal of the material is to get you approaching the markets from a healthy perspective.

Everyone, keep in mind that it's really easy for our ego to get in the way when stuff like this comes up. I mean, he's critically asking about something you guys like, so it's easy to be taken personally and lose a bit of objectivity (or even empathy, like trying to see it from his point of view.) Ultimately the poster is just "kicking the tires" a bit, not attacking, as he appears to be a skeptical trader...and who wouldn't be skeptical? Think about all the rip-off artists out there in this industry... if you have been though a few of them, you'd be just as skeptical.

I am talking about whether the help is actually HELPFUL, not harmful.

In short, yes.

The core reasons why would be that the material conveys the following:

  • Observation of patterns during specific time periods (along with 'profiling' your desired trading pair,) instead of just looking for patterns out of a book or trading off any signal. You are doing the analysis here with tools provided, not being spoon fed how each pair acts.
  • Proper money management with a high reward to risk ratio. Along with proper expectations of results (expect losses, no perfect system, etc..)
  • Proper risk management
  • Not over trading. (Patience is stressed.)
  • Not doing silly betting strategies like martingale or averaging down blindly.
  • Not feeding people trades but instead teaching them how to figure out their desired market themselves.
  • ... this list goes on.

And all of that would be immensely helpful for new traders or traders who need to "fix" their approach to the markets... regardless of them taking up the more specific analysis methods that ICT teaches.

The best part is, you are only committing your time here, there's nothing to be "bought".
 
I can see where your coming from robot but one thing I'd say is what Bruce Lee said, "Absorb what is useful, discard which is not." However you may choose to act just keep that in mind because you may agree with some things but mutate the minor details. As far as the proof is concerned i don't know how Clark would feel if I shared his and ive seen enough of his live trades spank me to say he's legit.

Realistically I don't know what level your at right now but if you got a spare day or two thumb through some of the material. What's your time worth to you is what Jack used to say to me?
 
Hi Robot,

I can tell you my own experience that I have learned a lot from ICT. Oh, so many things I could never even think I could learn. Trust me and others here, there is no easy way and someone like ICT knows it and offers a framework and real life observations where everyone willing can build up their ”inner trader”. Now ask your self, ”Why I'm Looking Systems?” and take some time to think all the systems you obviously have encountered with bad experience. So, are they any good? If you had the courage you would see that these so called “systems” have already ruined you mentally. So best thing you can do for now is to stop chasing them. I mean really, take some time for this, at least 6 months like ICT recommended and start on the ground.
 
Take a close look at this chart exercise, when ICT talks about weekly higher highs and lower lows, this can be a signal of a market change ahead, in this case two times within 9 weeks just for this example, you might think 9 weeks to wait for a trade is pretty dumb, well is it? it is a bit of a long time to wait in my books, but! if i keep running this chart set up for what it is and nothing else, then i'm happy to wait for this concept on its own. Price tends to break each weeks high & low as a norm, but then a lower low and a higher high forms before each trend reversal, nothing to say that's what happens before every change, though it is a good time to load the gun and start aiming. note the divergence in the H4 at the same time of reversal!
note - of course there are other pairs to plot this concept onto, though you don't want to spread your self to thin either id say
 

Attachments

  • 09 24 13.png
    09 24 13.png
    43.9 KB · Views: 91
For 10 years the EURUSD yearly highs have been above the purple line and conversely the lows have been below the purple line, range of about 400 pips, this year we broke the previous years high, last year we broke the previous years low, hmm, has this years high already been put in place and will we see a B line to get under the purple line again!!! more and more analysis is pointing towards the EURUSD stepping to great lows over time. but hey, i'm just a carpenter by trade, so don't take my opinions to seriously, and i have only been doing this for 16 months
:nickleflip:
 

Attachments

  • 09 24 13 yearly highs and lows.png
    09 24 13 yearly highs and lows.png
    43.3 KB · Views: 76
GdayFx said:
Take a close look at this chart exercise, when ICT talks about weekly higher highs and lower lows, this can be a signal of a market change ahead, in this case two times within 9 weeks just for this example, you might think 9 weeks to wait for a trade is pretty dumb, well is it? it is a bit of a long time to wait in my books, but! if i keep running this chart set up for what it is and nothing else, then i'm happy to wait for this concept on its own. Price tends to break each weeks price level as a norm, but then a lower low and a higher high forms before each trend reversal, nothing to say that's what happens before every change, though it is a good time to load the gun and start aiming. note the divergence in the H4 at the same time of reversal!
note - of course there are other pairs to plot this concept onto, though you don't want to spread your self to thin either id say

Hello Gday. I couldnt recognize the indicator on this screen. It is not Stoc or RSI, right?
 
GdayFx said:
For 10 years the EURUSD yearly highs have been above the purple line and conversely the lows have been below the purple line, range of about 400 pips, this year we broke the previous years high, last year we broke the previous years low, hmm, has this years high already been put in place and will we see a B line to get under the purple line again!!! more and more analysis is pointing towards the EURUSD stepping to great lows over time. but hey, i'm just a carpenter by trade, so don't take my opinions to seriously, and i have only been doing this for 16 months
:nickleflip:

Congratulations Gday, once again you have me thinking..( i know because it hurts) :eek:

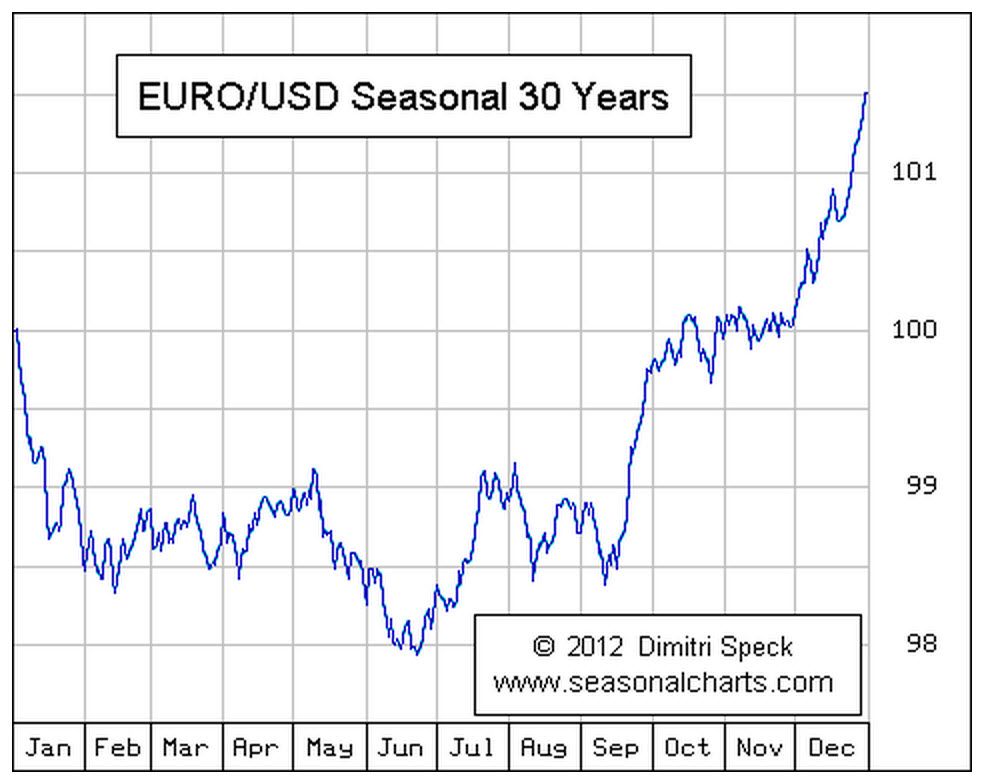
There sure would be plenty of stops beneath the 2750 level and we're testing the three yearly average price but what about the seasonal tendency? its usually bullish from now till the end of the year, youre talking about a big move down;

eurusdSeasonal_zps4d12a935.jpg


PS. are you sure youre not ICT?! ;)
 
Heres what im looking at for the week.

USDX broke below monthly lows and is now consolidating and making a possible more to retest the low at 80.750.

Coincidentally, EUR is retracing recent moves and is trading back into previous month highs at 1.34500 institutional level.

In addition, yields are starting to diverge from one another, with US 5yr yield making lower lows while bunds and eurobond are making higher lows, signalling a possible increase in interest rates in the near term which is bullish foreign currency.

Possible low of week at 1.34500 to form between now at wed? what do u guys think..
 

Attachments

  • USDX.PNG
    USDX.PNG
    39.4 KB · Views: 42
  • EUR.PNG
    EUR.PNG
    24.8 KB · Views: 32
  • Yield.PNG
    Yield.PNG
    15.2 KB · Views: 40
Not really sure, but how did they get 35 years of data for the EUR when the EUR was formed in 1999 lol....
foreigner said:
Congratulations Gday, once again you have me thinking..( i know because it hurts) :eek:

There sure would be plenty of stops beneath the 2750 level and we're testing the three yearly average price but what about the seasonal tendency? its usually bullish from now till the end of the year, youre talking about a big move down;

eurusdSeasonal_zps4d12a935.jpg


PS. are you sure youre not ICT?! ;)
 
kongzz said:
Heres what im looking at for the week.

USDX broke below monthly lows and is now consolidating and making a possible more to retest the low at 80.750.

Coincidentally, EUR is retracing recent moves and is trading back into previous month highs at 1.34500 institutional level.

In addition, yields are starting to diverge from one another, with US 5yr yield making lower lows while bunds and eurobond are making higher lows, signalling a possible increase in interest rates in the near term which is bullish foreign currency.

Possible low of week at 1.34500 to form between now at wed? what do u guys think..

Hey mate!
Where did you got that DX chart?
 
Simr said:
Hi Guys,

Looking at EU just on the day of FOMC. We were coming off a lower high on the 4h , plus price was sitting at OTE short. ( 20 aug HIGH and 06 Sep LOW). I had taken my longs off prior FOMC because of this reason.

Then ICT tweeted that he was long. Am sure there are more of you who were long too. Was wondering if any of you care to share the reasons for being long that day.

thanks

Hi Folks
I just signed up for twitter and not sure how it works yet. Can anyone tell me how to find ICT so I can get his tweets?
Thanks
 
duderino said:
Hello Gday. I couldnt recognize the indicator on this screen. It is not Stoc or RSI, right?

Actually it could be stoch or MACD.

Essentially the same thing pretty much to me anyways
 
walshman said:
Hi Folks
I just signed up for twitter and not sure how it works yet. Can anyone tell me how to find ICT so I can get his tweets?
Thanks

Search for ICT_MHuddleston on twatter
 
walshman said:
Hi Folks
I just signed up for twitter and not sure how it works yet. Can anyone tell me how to find ICT so I can get his tweets?
Thanks

https://twitter.com/ICT_MHuddleston

The other one is inactive so a random search might give you the right one or the dead one.
 
Hi, yea it could head higher from here indeed, im not saying it wont, i tend to look at the long term perspective at times. Also NZDUSD looks to loose a lot of ground long term, as the kiwi is over valued, and Aussie could make lower lows, so where does that leave the euro i wonder. Im thinking south in the big picture. maybe the dollar will be bought up when equities come off in time. How far back can you see on that seasonal tendency chart you have there, can you send me a link? (its ok i found it) and no im not ict lol, i live in a rural part of Sydney Australia

foreigner said:
Congratulations Gday, once again you have me thinking..( i know because it hurts) :eek:

There sure would be plenty of stops beneath the 2750 level and we're testing the three yearly average price but what about the seasonal tendency? its usually bullish from now till the end of the year, youre talking about a big move down;

eurusdSeasonal_zps4d12a935.jpg


PS. are you sure youre not ICT?! ;)
 
When i can i will make a video on how i came up with that indicator and how to use it! just give me a bit if time, cheers

duderino said:
Hello Gday. I couldnt recognize the indicator on this screen. It is not Stoc or RSI, right?
 
Yea Fibre Cable Aussie & Kiwi could be on a possible bounce to the upside, USDCAD seems to be running out of steam to, also note Kiwi just had a fairly bad Trade Balance read, so i might hunt for sell set ups on Kiwi over the next couple of weeks for a longer term move to the down side, as the Technicals are looking bearish also
 
kongzz said:
Hey piper, its AVAFX meta trader platform. they have pretty much all the possible future indices there.

Thank you,its much better then the Forex ltd one. :)
 
FTMO Trader Scouting
Back
Top