using bonds in intermarket analysis

brians1128

Well-Known Member
Hi guys, im Brian i started doing alot of intermarket work lately using cot reports, crb index, dollar index and have really been trying to get my grasps on using bonds and interest rates to support my fx trades, i wanted to start a thread which we can discuss and show examples of how we can use bonds to help give further conformation or setups in determining reversals or continuations in the markets.
 
I am very interested in this topic as well. I know bonds and bond yields can be used to help fuel a trade idea/direction, but I don't know how.

I would love to see someone that is seasoned in using intermarket analysis while trading fx post some charts and how it helped their trade.

I would also like to know where the best place is to get these charts (preferably in MT4 via a demo account or something).
 
slugFX said:
I am very interested in this topic as well. I know bonds and bond yields can be used to help fuel a trade idea/direction, but I don't know how.

I would love to see someone that is seasoned in using intermarket analysis while trading fx post some charts and how it helped their trade.

I would also like to know where the best place is to get these charts (preferably in MT4 via a demo account or something).

This is something I can dig into.

Having a good source on data for charting bonds is important and even when (fx) brokers provide "Bond futures" they are usually CFDs and not quite the underlying prices. I know a few data feeds worth checking out.

Can't promise anything tonight (it's pretty late) but I'll compile a few things together and drop it back here soon. :)
 
Jack said:
This is something I can dig into.

Having a good source on data for charting bonds is important and even when (fx) brokers provide "Bond futures" they are usually CFDs and not quite the underlying prices. I know a few data feeds worth checking out.

Can't promise anything tonight (it's pretty late) but I'll compile a few things together and drop it back here soon. :)

Nice! Looking forward to it!
 
What I typically do is


N1L969V.jpg


t7lps4m.jpg


8VXpabn.jpg


qEarYxx.jpg


Some people are more crazy... They take the US bond yields and match it with the JPY yields to check for divergences or to see which falls faster. I've never really gave it much effort or thought and when I did I failed so I've stuck with this
 
That is helpful man. So the yields (which are the opposite of the actual bond prices) are positively correlated with the US Dollar?

What website are you getting the yield charts from? I know ICT has mentioned that one in the past, but I forgot what it was.

So basically to summarize that trade.. the us bond yields had all pretty much broken down (market structure) at the same time that the USDX did as it fell through a key level and the Commercials were somewhat heavily net long on the CAD therefore you shorted USD/CAD (I'm assuming with other technical confluences such as OTE, etc.)
 
Tansen said:
Yes.

Exactly

http://stockcharts.com/freecharts/perf.php?$UST2Y,$UST5Y,$UST10Y,$UST30Y

Bloomberg also has one but, I don't remember the chart codes.


Also, if you see the pair now it's rallied, but if its going to continue I'm not sure but I am staying away for the week until I can get a clearer grasp since all we've been doing is consolidating.

Yeah, I made 7.34% today on 2 trades risking 2% each (one was closed before opening the other, I didn't have 4% open at one time) on the Fiber. Shorted at LO and went Long at NYO :)

The Bloomberg codes are something like usgg5yr:ind

And.. is that a daily chart of the bond yields? When is it updated fore the previous day?

Another thing I forgot to mention is the huge divergence between the 5 & 2 yr yields:

P0T9NN3.png
 
great job guys i too am using bloomberg and while i dont use them every day i use them similar to you i look for failures and shift in market structures from risk on to risk off. probably bc i need to research more about it so i can use them more. gonna reread your work and i believe ict has a video on his youtube channel i will look for and post over here

B
 
Tansen said:
Yes.

Exactly

http://stockcharts.com/freecharts/perf.php?$UST2Y,$UST5Y,$UST10Y,$UST30Y

Bloomberg also has one but, I don't remember the chart codes.


Also, if you see the pair now it's rallied, but if its going to continue I'm not sure but I am staying away for the week until I can get a clearer grasp since all we've been doing is consolidating.


thanks for the link
 
Hello slugFX

I always get confused when it comes to divergence...

Let me see if I get this wright...

slugFX said:
Another thing I forgot to mention is the huge divergence between the 5 & 2 yr yields:

The 2 YR bond yield failed to make higher highs. Therefore, this is a sign that there will be a market shift.

In this case, can we consider a risk on scenario (USD index is bearish) since the yields value shifted down?

This would have led the Fiber to rally up?.

Cheers,
Seb
 
Ok, couple of quick things to add.

(Just for clairity)
Bonds in general: Bonds are a debt security. Even though bonds come in many shapes and sizes, and are issued by many different types of entities (Corporates, municipalities, states/provinces, public utility companies, sovereign governments, etc...,) for the purposes of this inter-market analysis in cash/forex, we are focused on US government bonds at various maturities.

Maturities are when the bond is set to 'mature/expire' and is repaid in full by the issuing party. The longer time horizon to maturity, the more risk is involved since there's more time 'into the future' of unknown events for something to go wrong that might affect the bond's value. So generally speaking, unless the market strongly believes there will be lower interests rates in the future (which is called an inverted yield curve, which I will talk about later,) the further you go out in maturity times the more the bond will yield.

Bond Yields, and effective yields, come in two components: The coupon rate set on the bond at issue, and the bond's par value in the active market.

There is an inverse relationship between bond prices and interest rates. This is because a bond's price in the active resale market reflects its fair value when compared to all other bonds currently available. Should newly issued bonds have different a different yield (coupon rate,) for the same time to maturity, then existing bonds in the market must be repriced to reflect the current market rate.

For example: If interest rates rise, existing bonds must be priced lower than their face value (being what is paid out at maturity) to make up for the difference in interest paid on the coupon. The buyer then gets the capital gain between what they paid for the bond and what the bond issuer pays out to them at maturity in order to make up for the lower interest rate they were paid during the life of the bond. Inversely, if interest rates fall, then older bonds are clearly more attractive since they still pay out the higher rates from the past, and thus the price of the bond could rise above their face value to compensate (meaning someone is going to pay more than par on the bond, but the capital loss they realize when the bond matures is covered by the higher coupon they received while holding the bond to maturity.)


Interest rate futures (or financial futures) as we've been looking at in this thread are tracking the interest rates and values of various federal bonds and their respective times to maturity. They are NOT actual bonds in themselves, but a futures contract on the value of such bonds. That means we can track them for the information they give us on bond yields and prices, but we can't trade them directly expecting them to behave and act like a bond.

For instance: If you go long the front month 5 year interest rate futures contract, it would expire within 3 months unless you rolled it forward into the next futures contract, not in 5 years like a bond would if you were to buy the underlying US 5 Year note. As well, if you kept rolling your futures contracts forward for years, you would always be exposed to the 5 Year note's value, but if you bought the underlying 5 Year note, in 2 years it would become AND ACT like a "3 Year note" since it's time to maturity has decreased.

The distinction is important since you'll realize that the futures market is really there to help people exposed to bonds hedge their risk... or others who want exposure to interest rate changes, and who don't want to tie up capital holding the underlying bonds, gain said exposure with minimal margin put up.

I realize this sounds like the absolute basics, but I just wanted to be clear since we are talking about financial futures as a way of pricing out current interest rates and bond prices, and it would be easy for new traders to get these securities mixed up. Heck, I even found a website (semi-popular at that) which misinformed people that the US Government sells and primarily trades Treasury bonds on the CBOT... sigh... so much misinformation online, so I'm just trying to be clear about what's what.

Financial futures are a bond pricing and analysis tool as far as we are concerned, not bonds themselves. (Of course, you are welcome to trade financial futures on their own, no one is stopping you there, but that's not quite what this thread is about..)
 
(Expanding on what others mentioned)
On divergences between different times to maturity: I noticed people talking about price diverging differently between 5 year and 10 or 30 year bonds. This divergence is what makes up yield curve changes.

The yield curve's slope represents how people feel about interest rates changing over time and going into the future.

Charting out the yield curve might be useful to see what kind of overall market sentiment the street has in longer term trades (or, in cases where the market is about to be turned upside down, you'll note that yield curve tends to get flat or takes on a negative slope. Watching the changes to the yield curve just before and during the credit crisis of 2008-9 is a good example of this.)

For an illustrative example:
http://stockcharts.com/freecharts/yieldcurve.php

Click the "animate" button and watch the curve change over time (with the red vertical line showing the point in time on the right side chart, drag this to your desired date.)

Here is a snapshot of a healthy curve during a bull market:
nhA5Oov.png


And here is ~6 months before the credit crisis start to really take off:
8ALRrgB.png
 
For charting the change in value between bonds themselves, Tansen already linked a decent source on charting:

Tansen said:

This is, of course, a long term sentiment you'll be following with these charts. You can not expect to scalp with this info, but it can tell you when you'll want to pay attention to moves in the dollar index or dollar based pairs.

The connection between the dollar's value and bonds is at a fundamental level:

In order for people to buy US bonds, they need US dollars. In order for people to buy Euro/German/French/etc.. bonds, they need Euros. Capital will flow around the world naturally to where it can be employed and gain the greatest yield/return relative to the risk involved. If people expect higher yields will be found State-side, then capital will flow into the US dollars from Euros (and elsewhere) in the staging process of being employed in the US to gain some returns.

This is why base central bank interest rates matter so much to forex pairs. This is why rate decisions can be one of the most sharp price moves found when comparing volatility around news releases. When a country raises their rates, capital is attracted to them (assuming inflation is tame enough, as I said, all relative to risk) and their currency tends to appreciate.

So, as a proxy to this sentiment (of capital flowing into and out of a given currency thanks to the improving or diminishing economy,) we can watch bond rates/yields in the US and the dollar index (DX contracts) and gain a sense of what's going on and what biases we should have going into longer term FX trades.

To be clear, there's going to be a million other reasons why yields and bond rates change, but should money be flowing into or out of USD, we know other currencies must be spent or bought in order to do this, and thus we have an idea of currency strengths or weaknesses based on this. It's all supply / demand after all.

I know (and have personally seen) Tansen take 400-600+ pip swing trades after assessing this. That's not to say such trades come every day, often the setups can take a few weeks to even show up and a few weeks to play out.. not to mention getting a good entry without being prematurely stopped out is a craft in itself.. but using this analysis for longer term market trends can create some nice results.

One thing to keep note of: You're not just trading the US economy... a position in a currency pair also includes sentiment on the other side of the transaction.

For instance, a EURUSD trade will have as much to do with US sentiment as it does the Euro zone. Sure we can assume forces around the economic powerhouse that is the US will outweigh the Euro influence, but it is still the EURUSD exchange rate after all and what the ECB does will affect it greatly. So having your head wrapped around the current credit, interest rate, and yields found in the paired currency you are trading is an obvious must. You don't have to base your trade on them, and you can focus on the USD resources this thread talks about already, but don't ignore major rate decisions pending, or Euro bond auction results within the Euro zone if you're in a EURUSD position... they still matter.
 
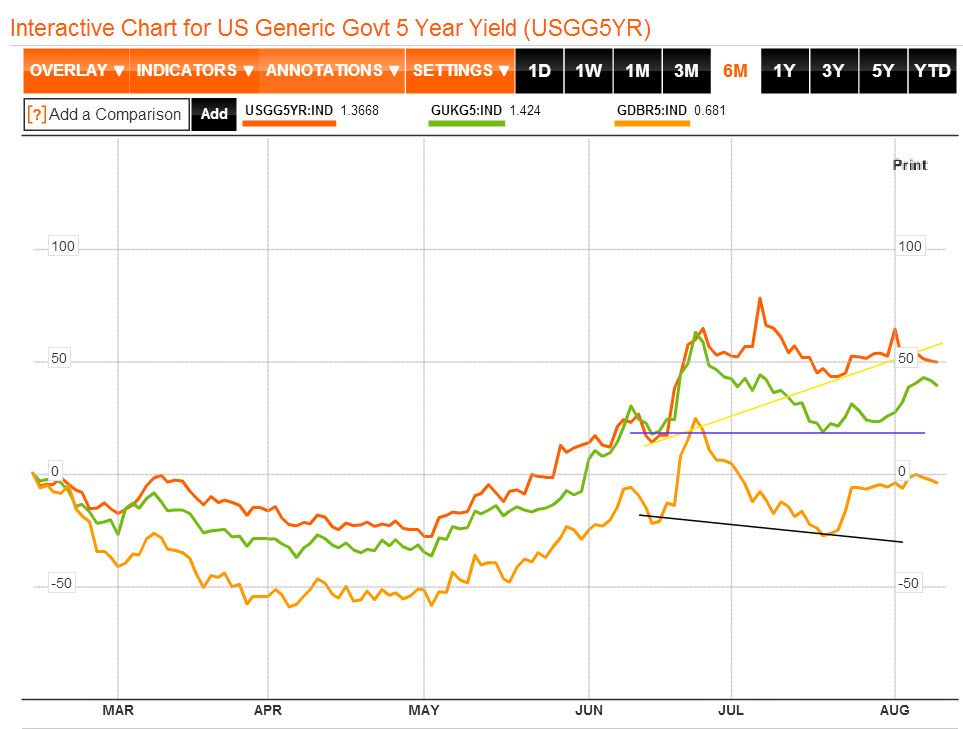
Yield Divergence Question

Question for ICT or other Guru;

If the bond yields diverged on the 22nd July effectively shunning lower yields (Bearish FX), why has EU and GU continued to rise for weeks now?

BondTriadDivergence_zps10bed31c.jpg


Thanks in advance.
Alex
 

Attachments

  • Bond Triad Divergence.jpg
    Bond Triad Divergence.jpg
    70.8 KB · Views: 74
Re: Current Yield intermarket analysis

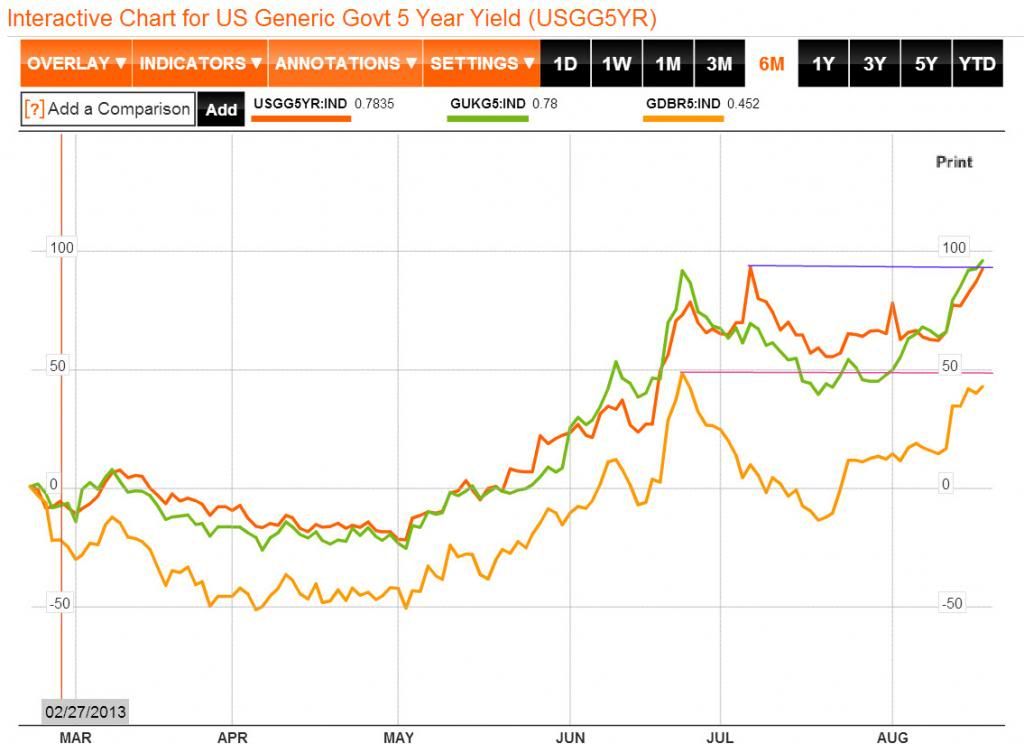
Can anyone explain what the bond yields are indicating?

To me they look as though theyre about to breakout to the upside which would equate to a risk on scenario for FX if Im not mistaken?

That said, they have diverged slightly with the UK yield making a higher high so could this indicate weakness in FX?

BondTriad_zps5b697e25.jpg


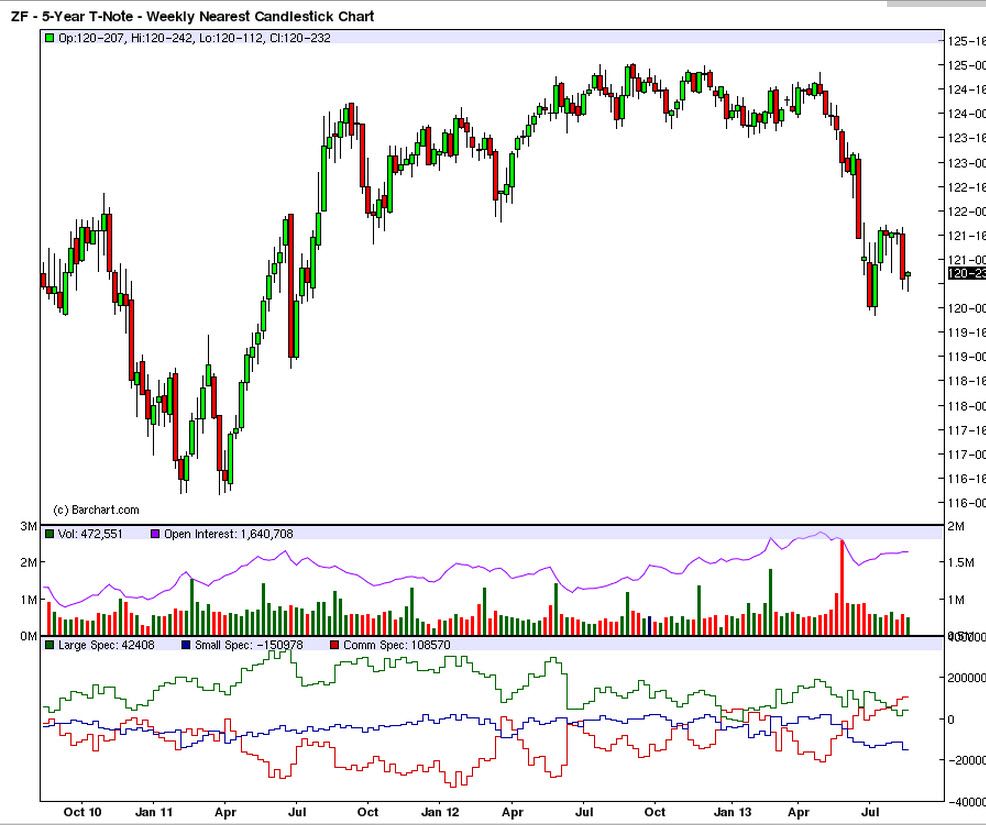
In Addition, the 5 year T note appears bullish in that the commercials have increased net long position (COT) also the net open interest has declined as the market fell indicating strength.

Does this add up to further risk off expectation in FX? ie. Bonds in demand = Interest rates lower)

5YrTNote_zps598ac541.jpg
 
Re: Yield Divergence Question

I believe this chart would be a bullish divergence.

sinsemilla said:
Question for ICT or other Guru;

If the bond yields diverged on the 22nd July effectively shunning lower yields (Bearish FX), why has EU and GU continued to rise for weeks now?

BondTriadDivergence_zps10bed31c.jpg


Thanks in advance.
Alex
 
Re: Yield Divergence Question

slugFX said:
I believe this chart would be a bullish divergence.

Thanks for the reply! Can you explain why the EURUSD has continued to rise since this divergence if higher yield = Bearish FX?
 
I also believe that higher yield = bullish FX. Basically which ever direction that yield goes is where EUR/USD & GBP/USD should go. They are positively correlated.

I got this information from ICT's Trading Plan Development Series Part 1. It is a very long one, but it is a gem!
 
Back
Top