SMT Divergence

FTMO Trader Scouting

outthislife

Well-Known Member
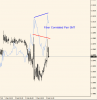
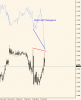
So ICT just held an SMT divergence live session and answered some questions. The idea is to find divergences in the inverted correlation vs the USDX and conflate this other tools (OTE, OB, ToD/DoW).

Is anyone using this in their own system? Why / why not?
 
It is a clear indicator of over bought, over sold and accumulation across the board, line this up with ToD, ToW and OB's then the power is yours.
The only thing i would like to know is, how do we toggle off the horizontal lines? in the overlay indicator
 
I was attempting to use them but with little success. I obviously was not reading correctly as I missed some big moves. I also missed most of the event today and hoped someone recorded it. Definitely need help in this area.
 
walshman said:
I was attempting to use them but with little success. I obviously was not reading correctly as I missed some big moves. I also missed most of the event today and hoped someone recorded it. Definitely need help in this area.

ICT will release the recording Monday night your time, i think he said...
Have you got the overlay indicator?
 
SLT said:
ICT will release the recording Monday night your time, i think he said...
Have you got the overlay indicator?
Just saw he released recording :)
I do have the indicator.
I was trying to look for divergence with fiber, cable and USDX charts tiled vertically on screen. I will have a look at the indicator after I watch the video. :thumbsup:
 

Attachments

  • SMT.PNG
    SMT.PNG
    28.4 KB · Views: 678
Hi guys I'm quite new to ITC concepts so please excuse me if I ask noob questions or say things that are obvious, but from what I understand the SMT is something that is used as a confirming tool to help one to decide to take a trade and not a tool to "find" trades. e.g. there must be a framework for a trade already in place before looking SMT. Do you agree?
 
walshman said:
Just saw he released recording :)
I do have the indicator.
I was trying to look for divergence with fiber, cable and USDX charts tiled vertically on screen. I will have a look at the indicator after I watch the video. :thumbsup:

May I have the indicator please?
 
Maxwell said:
Hi guys I'm quite new to ITC concepts so please excuse me if I ask noob questions or say things that are obvious, but from what I understand the SMT is something that is used as a confirming tool to help one to decide to take a trade and not a tool to "find" trades. e.g. there must be a framework for a trade already in place before looking SMT. Do you agree?

So I slept in past LO and NYO, and awoke to find price back up in the area where the cable was accumulating shorts, and we saw that it ran the stops above the double top from friday when the markets opened yesterday. So expecting downward move in price, and still looking for completion of the MM sell model we are currently in. I saw price retracing up into OTE so that's when I started looking for SMT divergence. Cable had both USDX and correlated pair divergence...so I sold on the 5 min OTE after the initial LC retracement. Banked a quick 30 pips and I'm holding for the lows of the day to be taken out.

To your specific question, I use it a lot...not for every trade, but I probably should : )
 

Attachments

  • Correlated Pair SMT 2 2.PNG
    Correlated Pair SMT 2 2.PNG
    19.5 KB · Views: 628
  • USDX SMT 2 2.PNG
    USDX SMT 2 2.PNG
    23.9 KB · Views: 519
  • 2 2 GBP.PNG
    2 2 GBP.PNG
    37.7 KB · Views: 499
I've got to say, it seems like an unnecessary extra layer to confirm what's already obvious.

Like the above for the cable: it was taking out potential stops at 1.5072 so pend sell @ 1.5074 OB or even the fib OTE. Took this trade without SMT divergence and I just don't see how it would help?

Can someone help explain?
 
Well, perhaps one may have been looking at today as a NYO reversal day. Price dropped down to right near the big fig (1.5000), bounced 3 times down in that area, and then shot up. If someone just woke up to look at the charts during LC like I did, they might see this as a day that would ultimately move higher, but I saw the divergence at that time and it gave me confidence that they were just bring price back up to fill more shorts, not to continue higher. Does that make sense?

Matty
 
outthislife said:
I've got to say, it seems like an unnecessary extra layer to confirm what's already obvious.

Like the above for the cable: it was taking out potential stops at 1.5072 so pend sell @ 1.5074 OB or even the fib OTE. Took this trade without SMT divergence and I just don't see how it would help?

Can someone help explain?

I've found it a frustrating tool to implement on the "hard right edge". I think if a trader spent the same time that they were going to spend focusing on SMT divergences, on slow stochastic divergences instead, they'd be a lot better off..

/my opinion

PS i wasn't at the SMT webinar, "J.Livermoore"
 
Well, Michael said in the webinar that he pretty much never takes a trade that doesn't have SMT divergence....so..... yeah.

If its good enough for him to include it in most, if not all, of his trades, its probably good enough for me. ;D

Matty
 
the golden gun said:
I've found it a frustrating tool to implement on the "hard right edge". I think if a trader spent the same time that they were going to spend focusing on SMT divergences, on slow stochastic divergences instead, they'd be a lot better off..

/my opinion

PS i wasn't at the SMT webinar, "J.Livermoore"

Right. I was there for the full duration and the method "makes sense" but it doesn't really offer insight that you couldn't glean from other analysis already.

Surely I must be missing something.

joepippin said:
I use it. Not for every single trade but it's good to see support a trade idea that's unfolding.

So it's an extra signal?

matty44 said:
Well, Michael said in the webinar that he pretty much never takes a trade that doesn't have SMT divergence....so..... yeah.

If its good enough for him to include it in most, if not all, of his trades, its probably good enough for me. ;D

Matty

:-\
 
look i'm a wizard.

no video necessary, lol
 

Attachments

  • ssto_cable_feb2_1.jpg
    ssto_cable_feb2_1.jpg
    62.2 KB · Views: 471
  • ssto_cable_feb2_2.jpg
    ssto_cable_feb2_2.jpg
    62.4 KB · Views: 390
I mean, if you can always determine what direction the market is going to go every time you place a trade without using SMT, then you don't need it >:D

But if you're like me, and you are looking for all the info you can get you hands on to help you anticipate where price is going, then I'll gladly take advantage of SMT concepts.

If S/R concepts yield a 30% win rate, maybe S/R + fibs = 50% win rate, and maybe S/R + Fibs + OB = 75%, and S/R + Fibs + OB + SMT.....you get the picture.

Matty
 
the golden gun said:
look i'm a wizard.

no video necessary, lol

o0y0h.gif


matty44 said:
I mean, if you can always determine what direction the market is going to go every time you place a trade without using SMT, then you don't need it >:D

But if you're like me, and you are looking for all the info you can get you hands on to help you anticipate where price is going, then I'll gladly take advantage of SMT concepts.

MAtty

Fair enough.
 
matty44 said:
I mean, if you can always determine what direction the market is going to go every time you place a trade without using SMT, then you don't need it >:D

But if you're like me, and you are looking for all the info you can get you hands on to help you anticipate where price is going, then I'll gladly take advantage of SMT concepts.

MAtty

sure, makes perfect sense. Just promise to come back and share your opinion on the first trade that fails after what appears to be a valid SMT divergence signal...

for your own safety, just make a tally of the trades that you feel "SMT divergence" contributed to significantly. Then see if those trades are net profitable.
 
FTMO Trader Scouting
Back
Top