You are using an out of date browser. It may not display this or other websites correctly.
You should upgrade or use an alternative browser.
You should upgrade or use an alternative browser.
Scout Sniper Basic Field Guide - InnerCircleTrader
- Thread starter TheInnerCircleTrader
- Start date

Michael's work really has caused some fascinating discussions with myself.
I was looking at the USDJPY yesterday, post LO close, and saying to myself "That's a massive buy signal", but I was responding with "One misfired bullet in the Crimea and that's going the other way".
Crimea sent me back to a default "don't trade it" signal. No one shot each other but the pair shot up 75 pips. Putin wins this round!
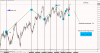
If you use the 2014 yearly open as a benchmark againt EURUSD, Yields and the futures T note, you will see that the T note is higher than the benchmark, Yields are lower than the benchmark and EURUSD is back even with the benchmark. EURUSD could come under heavy selling pressure soon this week or there after, also German yields are the lowest out of the 3 bond yields.
Look for technical levels to play out, ie weekly highs and lows, then its Party time 8)
NY sold off last night from the previous 2 week highs 50 pips for ya
Look for technical levels to play out, ie weekly highs and lows, then its Party time 8)
NY sold off last night from the previous 2 week highs 50 pips for ya
I was thinking to go short only if it reaches 1.6700, maybe NYOGdayFx said:Pound concept
yet another losing trade, cable went up just the right amount of pips to take my stop before going in the direction I anticipatedovidiux said:I was thinking to go short only if it reaches 1.6700, maybe NYO
ovidiux said:yet another losing trade, cable went up just the right amount of pips to take my stop before going in the direction I anticipated
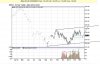
Of course this is after the fact (and I do not trade the GU at the moment), but it looks like a nice Reflection pattern.
The 1.6730 level is on my Key SR shortlist (see highs at end of April 2011)
Attachments
About in the same boat. That massive buy signal on Monday on USDJPY has run an uptrend all week. Yet I can't seem to find what's driving it. I know the Yield divergence happened, but I can't find anything (minus a big rally in the Nikkei) that really suggests what is going on.
My thinking, at the moment, is that Crimea news freed up enough liquidity that they smart money can move to their next objectives? Still seems like a strange week, especially on the Thursday before a Non-Farm Payroll, to be stretching for new highs/lows.
Next week's COT data should be pretty eye opening.
sqa said:About in the same boat. That massive buy signal on Monday on USDJPY has run an uptrend all week. Yet I can't seem to find what's driving it. I know the Yield divergence happened, but I can't find anything (minus a big rally in the Nikkei) that really suggests what is going on.
My thinking, at the moment, is that Crimea news freed up enough liquidity that they smart money can move to their next objectives? Still seems like a strange week, especially on the Thursday before a Non-Farm Payroll, to be stretching for new highs/lows.
Next week's COT data should be pretty eye opening.
Sometimes its time to pull out the Elliottwave "Tool" and have a look at the bigger picture, and see what could be possible, at the moment the long train could be on a come back.
EURJPY has a liquidity pocket still sitting up there to, on the H4
Attachments
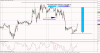
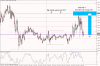
USDJPY just today hit a liquidity pocket it's been after for several weeks.
But it did finally dawn on me. USDJPY just completed a H4 Chart Buy Model. I completely missed it. The news Cycle just accentuated it. (Top at Feb 20 to 26, down 1 big step partially over news/weekend; two up thrusts this week.)
Though I still can't quite see the fundamentals working that way. But, the ADP report has payrolls down from expectations, it could be very much that the smart money is collecting to go back down. Given the USD value spike in USDJPY during a USDX downswing, something isn't lining up.
Actually, following through with my idea, if it is the completion of a buy model on the USDJPY in anticipation of lower job numbers, which explains the USDX lowering and commodity prices rising, then:
USDJPY should hover down to about 102.80 before the news, spike up to 103.50, then drop like a rock from there.
There are only 3 majority liquidity pockets near the current price action: 103.50, 104.50 and 101. It's headed to two of those, just not sure which. Tuesday's COT data should be enlightening.
marcusmcneice
Member
I got a quick question. I have setup the bond yield comparison chart with the 10 year US, 10 year German, and 10 year UK bond yield, as described in Episode 3. Is there a way to save that chart. I have bookmarked the chart in Chrome, but when you got back to it the German and UK yield are missing. I have to set it up each time. Is there a way to save the chart so all three come up when you go back to it?
Thanks.
Thanks.
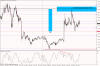
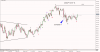
USDJPY broke 103.50, made a try for 103.80 but stopped a few pips short. The Monster liquidity pocket is up at 104.50, but there has to be something pretty massive in the Fundamentals that just doesn't seem to be showing for the Yen to make a play up that high.
(I should add that, per the COT data, in the 104-105 range is an entire year's worth of shorts taken by the commercials. As in they went from +250k to +100k over that range, before the downside at the end of January. Which means it just retraced... To the 70.5% line from the point before the drop off. And I took that trade. Welp, I'm holding that one for a while.)
Looking forward to ICT's breakdown of the USDJPY trade he took. I somehow saw the week as it started, but after Monday I just couldn't get my head around what was going on. (The insomnia *might* have something to do with that)
I did setup a Non-Farm Payroll trade, so I took the Short at 103.50. Didn't get stopped out and it's about +30 pips going into the weekend. Given what the pair has been up to, I'm going to see if I can hold it for a downside retracement next week. If it's looking like a downweek (when I run numbers Sunday), that should be somewhere between Wednesday & Thursday, which is when I'd be looking to get out.
Or I'm going to get obliterated again. Though in all of the insomnia, I think I finally figured out how to get a handle on the GBPJPY pair. And I feel a little stupid for not seeing it sooner.