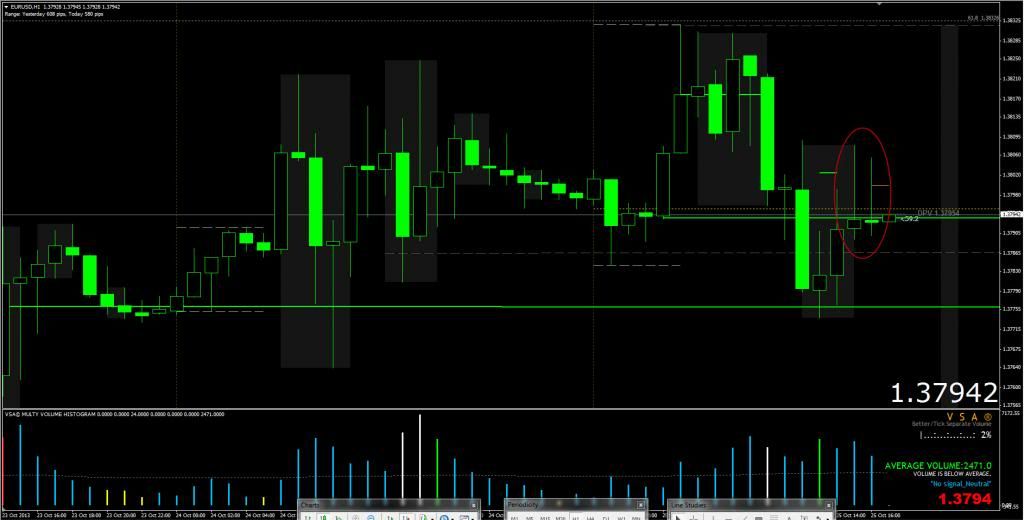
Well, it was an entry just demonstrated in the weekly market review video of 20 October
")
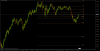
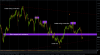
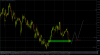
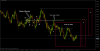
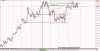
First determine a good SR line, which in this case was a hidden OTE @ 1.3620, just touched the 61,8% retracement on the 4H.
You could also use the swing point of last Thursday @ 1.3637, which would give you the 79% retracement.
See attachment 22oct13_4H.png
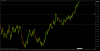
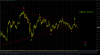
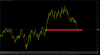
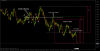
Next, determine entry point @ 1H, but the ideal entry was in Asia.
See attachment 22oct13_1H.png
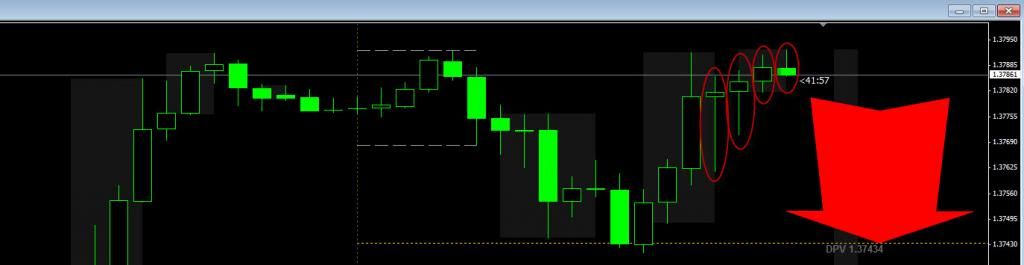
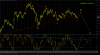
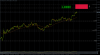
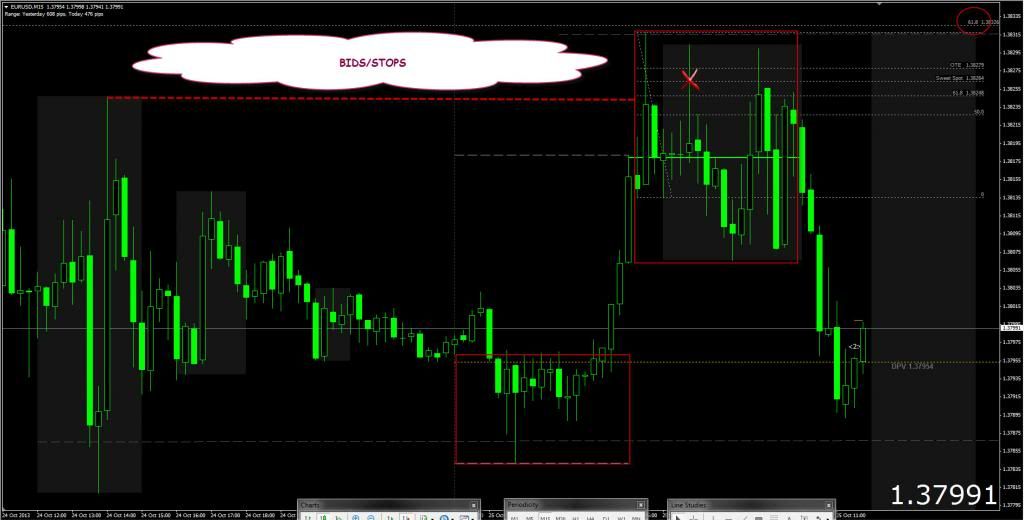
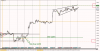
So zoom in to the 15 MIN to get in line with the Kill Zone. A beautiful entry was in the London Open:
See attachment 22oct13_15M.png
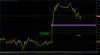
Take profit was determined on the 4H using the fib extension tool, 1.3780 was a nice figure to get out.