ICT Core Visual Ideas

gon

Well-Known Member
Hello.

As you know, ICT has his public Inner Circle Trader youtube channel and he, also, sometimes uses either Twitter or Telegram. For this reason, I am not going to explain here the details, but to share a few charts that may serve as a visual aid. ICT is complex and no one can teach it to you, you need to experience it yourself. All the ideas shared by me are my own interpretation of trading and how I have also integrated ICT in my own trading style. These ideas do not reflect or try to explain what Michael Huddleston teaches, it is my own vision, and I strongly recommend anyone to first study the original ICT materials.

In this set, I am sharing only a few core ideas that, however, are enough for the aspiring trader, to experiment with and formulate a working strategy after proper trial-error backtesting.

There are four main topics, I think, should be the initial concern of the ICT student:

  1. Market maker models
  2. Market structure
  3. Orderflow
  4. Multi-timeframe analysis

Being market maker models least important among all of them, it allows you to understand what the markets are doing.

Markets can be at a certain scale either consolidating or expanding. If you change your scale, the market phase will be different. It can be consolidating on H1 and expanding on W1 for instance. When you do not see any kind of structure in one timeframe, you will be able to find it on antoher timeframe. This is called markets fractality, and it means that if you do not see it, it is because it is happening anywher else you are not looking at.

So, let's start by the least important, the market maker models. Two things may happen:
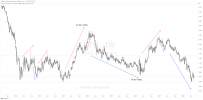
  • Markets are buying -> prices are falling.
  • Markets are selling -> prices are going up.
Here is a schema with red MM sell models and blue MM buy models at different scales and in several magnitudes. The secret to identify it: proportionality.

1656141261760.png
 
Then, Market structure, for me it is the most important. One can be trading just using only structure and nothing else for a lifetime.

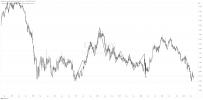
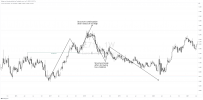
The structure can be studied using relevant highs and lows forming swings. See on the left an ascending structure and on the right a descending structure.

Always there is structure, if it is hidden to you, it is because it happens fractally at other scale you are not looking at.

1656141661404.png
 
The structure can be continued or can be broken. We refer to a rupture of the structure as the break in market structure (BMS) or break of market structure (BMS).


Here a continuation after a retracement, and here a reversal after a break in market structure. This chart only shows the BOS and the market continuation shapes. You must not infer anything else other that market structure is broken after a swing is violated by price, but it does not imply anything else other than we qualify the chart differently. But it does not change the bullishness or bearishness of the structure.

Let's keep things simple super clear and do not infer easy and childish conclusions.

1656142262078.png
 
To summarize the two last posts, markets are moving up when you have ascending structure and markets are moving down when you have descending structure.

Markets need to suffer a break of structure before they change their structural direction; but a BMS is not a change in market structure or a shift in market structure (SMS). Notice that SMS may also refer to smart-money shift that is another type of ICT concept.

Now that you know when markets are structurally going up and down, you are able to understand when the market structure has changed and which are the preliminary signs that it may happen.

I trade these ideas in two manners. When I use stop loss, I try to sell during market declines and close my trades before the falls end. When I trade without stops loss y only buy when prices are falling, and then I start to sell when prices start to move up.

The most common technique is the first one, using stop losses. Buying before markets are going to move up, with the lowest possible drawdown and closing these positions after prices rise. And doing the opposite in descending markets.
 
There are numerous structural setups, some taught by ICT, others that you find with experience.

The most common one I have found across ICT is the smart-money shift setup. This setup is not enough for trading, you need more convergence. But it represents one of the most important and old ICT signals. It is different from the ICT's 2022 mentorships, so do not ask about FVGs here as the answer is no.

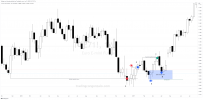
This setup is also an schema and it has many variations you start to identify as you gain experience. But there is one common structural shape that is given on a daily basis, and it is the one I am going to show here. But remember, it is a concept, it may appear to you with diferent shapes and not necessarily how I am printing it here.

In this example, and it does not always happen like this, but it happens often enough to be considered as a one setup for every day, we distinguish several phases:

  1. Markets are coming from higher levels (premium) into lower areas (discount)
  2. Price breaks a significantly important low, the stop-loss hunt or manipulative phase (the beginning of an old important range for instance) - red star
  3. Then, prices will eventuall create structure (red eye).
  4. Later, prices will break the structure (blue star).
  5. Finally, prices will come back closer to the area in which the old low was broken.
  6. After that, if prices move up without breaking the previous low, this may be a smart-money shift -SMS- candidate.(blue eye)
  7. A new high is creating, taking buyside liquidity (green star)
  8. and allocating that lower down within the SMS area. This is your potential entry area. (blue arrow)
  9. 1656143872392.png
This is one of the strongest setups I know and this is not enough for trading, but it is a signal that something is going on. If you know what you are doing, you can identify when this is a real entry signal.
 
Orderflow is the sequence of order allocation.

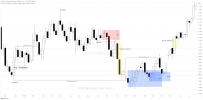
Orders are grabbed from liquidity areas, then markets take these orders on behalf of the participants and allocate them anywhere else. We know that if something happens within or close to these areas, chances for markets to move away quickly in the opposite direction are relatively high. On the other side, these areas will act as magnets for prices to move towards them.

There may be areas in which there is a lack of liquidity, thus prices will tend to fill them once they reach them, acting as continuation zones while not filled. We distinguish these areas from the liquidity areas and call them imbalances or liquidity voids. Fair value gaps are one type of imbalances, order blocks are one type of liquidity areas.

Let's see a few on the chart.

  • Old highs and lows
  • Orderblocks
  • Mitigation blocks
  • Breaker Blocks
  • Imbalances
  • Fair value gaps
  • Premium and discount levels
To sum up, all these areas represent zones in which one may expect things to happen strongly than in other areas. But the existence of one of these orderflow zoneas does not imply anything at all. Let's just say they are points of interest, nothing else.

1656144523171.png
 
You will build the multi-timeframe section as I am not explaining it.

Ask yourself:

If I am trading H4, what will happens if my entry signal happens all inside high probability structure and H4 orderflow and it is also occurring within W1 orderflow and structure with the same directionality, creating a strong convergence? What if my market maker model has ended there and I can now identify a new one in the same direction of my overall H4 and W1 bias?

Take your time to practice this idea.
 
Recommended series:

  • Scout sniper
  • Precision series
  • 2022 series. I haven't watched the series, but for what I have already seen, interesting topics including swing analysis, liquidity qualification and advanced market maker model concepts are covered.
 
Nice breakdown of his concepts. As you rightly say you have to go and see it for yourself and drill it in until you can't unsee it. Simply watching one of his videos on a topic isn't sufficient and I think this is where many fall down when learning.
 
Hello.

As you know, ICT has his public Inner Circle Trader youtube channel and he, also, sometimes uses either Twitter or Telegram. For this reason, I am not going to explain here the details, but to share a few charts that may serve as a visual aid. ICT is complex and no one can teach it to you, you need to experience it yourself. All the ideas shared by me are my own interpretation of trading and how I have also integrated ICT in my own trading style. These ideas do not reflect or try to explain what Michael Huddleston teaches, it is my own vision, and I strongly recommend anyone to first study the original ICT materials.

In this set, I am sharing only a few core ideas that, however, are enough for the aspiring trader, to experiment with and formulate a working strategy after proper trial-error backtesting.

There are four main topics, I think, should be the initial concern of the ICT student:

  1. Market maker models
  2. Market structure
  3. Orderflow
  4. Multi-timeframe analysis

Being market maker models least important among all of them, it allows you to understand what the markets are doing.

Markets can be at a certain scale either consolidating or expanding. If you change your scale, the market phase will be different. It can be consolidating on H1 and expanding on W1 for instance. When you do not see any kind of structure in one timeframe, you will be able to find it on antoher timeframe. This is called markets fractality, and it means that if you do not see it, it is because it is happening anywher else you are not looking at.

So, let's start by the least important, the market maker models. Two things may happen:
  • Markets are buying -> prices are falling.
  • Markets are selling -> prices are going up.
Here is a schema with red MM sell models and blue MM buy models at different scales and in several magnitudes. The secret to identify it: proportionality.

View attachment 8440
Do you happen to have links to his original material
 
Youtube: Inner Circle Trader
I’m fully aware of his YouTube channel, I have watched the scout sniper series, the market maker series and a few other of the playlists Michael has kindly put together. I was just wondering if the original pre-YouTube videos where still hanging about somewhere.
 
I’m fully aware of his YouTube channel, I have watched the scout sniper series, the market maker series and a few other of the playlists Michael has kindly put together. I was just wondering if the original pre-YouTube videos where still hanging about somewhere.
One of the most relevant series was the old market maker videos. Google for it and it may take you to the old vids from 2014 I think.
 
This whole feud is boring. I trust what I see with my owns eyes thanks. Don't care much for either of these two as people.
 
Hello.

As you know, ICT has his public Inner Circle Trader youtube channel and he, also, sometimes uses either Twitter or Telegram. For this reason, I am not going to explain here the details, but to share a few charts that may serve as a visual aid. ICT is complex and no one can teach it to you, you need to experience it yourself. All the ideas shared by me are my own interpretation of trading and how I have also integrated ICT in my own trading style. These ideas do not reflect or try to explain what Michael Huddleston teaches, it is my own vision, and I strongly recommend anyone to first study the original ICT materials.

In this set, I am sharing only a few core ideas that, however, are enough for the aspiring trader, to experiment with and formulate a working strategy after proper trial-error backtesting.

There are four main topics, I think, should be the initial concern of the ICT student:

  1. Market maker models
  2. Market structure
  3. Orderflow
  4. Multi-timeframe analysis

Being market maker models least important among all of them, it allows you to understand what the markets are doing.

Markets can be at a certain scale either consolidating or expanding. If you change your scale, the market phase will be different. It can be consolidating on H1 and expanding on W1 for instance. When you do not see any kind of structure in one timeframe, you will be able to find it on antoher timeframe. This is called markets fractality, and it means that if you do not see it, it is because it is happening anywher else you are not looking at.

So, let's start by the least important, the market maker models. Two things may happen:
  • Markets are buying -> prices are falling.
  • Markets are selling -> prices are going up.
Here is a schema with red MM sell models and blue MM buy models at different scales and in several magnitudes. The secret to identify it: proportionality.

View attachment 8440
THANK YOU FOR DOING THIS! This helps so much!
 
all ICT subs are " mindless fucks " according to mikey
 

Attachments

  • aa.jpg
    aa.jpg
    100.5 KB · Views: 32
  • ccc.jpg
    ccc.jpg
    60.3 KB · Views: 30
Why even bother chasing him so much where they all business partners before or something else that caused this beef ?
 
Back
Top