
You are using an out of date browser. It may not display this or other websites correctly.
You should upgrade or use an alternative browser.
You should upgrade or use an alternative browser.
ICT Advanced Price Action Trading Concepts
- Thread starter TheInnerCircleTrader
- Start date

Live Stream notes 2014-05-15
Cable.
Counter-Trend trades produce an In-Trend Open on the Day we're going Counter. (So, if Bearish Trend, look for a Down-move first in the Day, before a retrace)
Within Major price swings, there are smaller, child Price Swings. We can't just ignore them.
When Price is in a Sideways Consolidation, you don't take that trade.
When we're in a Bearish Market Environment: If you're expected to go Lower on a Daily Chart, your Eyes should be sensitive to the Price Action going into London.
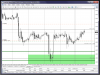
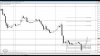
Looking at May 8th, when ICT got out of his Cable Longs and Flipped direction. (Picture #1)
It'll Open & Trade up. But you view that Up Move (in a Bearish market) as very Suspect. The Judas.
3 Things the Opening Move will Do:
1) Pull back to a Previous Range
2) Pull back to a Previous Order Block
3) Run Stops
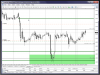
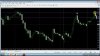
ICT Reflection Pattern
Usage: When approaching an old, important Level, you pull the Extension/OTE-adjustment during the consolidation. A 62% set on the previous High/Low is the "Voodoo" level, as in this Picture #2. Almost right to the pip.
ICT took the Trade at 1.6740, in this instance.
ICT uses 5 pips when Buying, to incorporate the Spread (and get his Fills).
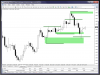
Using CDR! Let's explore.
If Price Runs Away from the CDR3, before London especially, it's a classic Market Reversal Profile.
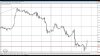
ICT showing off some Mad Prediction skills. The wonder of Time-Signed Video.
Showing SMT Divergence at the 1.3650 on Euro.
Attachments
This is a Blast From The Past set of notes.
Since it's pretty much the same teaching as the L-Range or 7-Range. In case it helps some others, just from the notes. Note: the file is in the Torrent that's still out there...
Since it's pretty much the same teaching as the L-Range or 7-Range. In case it helps some others, just from the notes. Note: the file is in the Torrent that's still out there...
Live Stream from 2012-08-19
Inside the Range - Classic ICT Knowledge Bombs.
1. Monthly Range
2. Weekly Range
3. Daily Range
4. Asian Range
5. ADR - Average Daily Range
6. Orders - Stops - Targets
7. Daily Trading Bias
What is the Monthly Range?
- Determine Current Market Structure.
- Focus on Swings & Turning Points.
-- Where have we been trading in terms of Support & Resistance?
- Note Key S&R Levels.
- Trade in the Direction of the Primary
-- Prevents a lot of scalping, but you stay in Trend --
--- High Impact/high probabilities Trades ---
What is the Weekly Range?
- Determine current Market Structure.
- Focus on Swing & Turning Points.
- Note Key S&R Levels.
- Trade in the Direction of the Primary.
- Looking for New OTE Reversals - Anticipate
-- Where are we coming From? Where are we headed? --
-- Weekly, Daily & H4 Charts will give you this information. --
-- If you don't have a premise in mind *BEFORE* you turn on the charts, you're just gambling. --
(Don't talk about your Trades, while you're IN them.)
What is the Daily Range?
- Use the Current Market Structure.
- Focus on Swings & Turning Points.
- Note Key S&R Levels Monthly - Weekly.
- Trade in the Direction of the Swing Point, with current Market Structure.
- Look for New OTE Reversals - Anticipate.
What is the Asian Range?
- Note the Initial Range High & Low.
- Narrow Focus to Higher Market Trend.
- Note Key S&R Levels with Old Highs & Lows.
- Trade in the Direction of the Daily Swing Point.
- Anticipate the London Stop Raid - Fade It.
What is the ADR?
(ICT does use a 5, 10 and 20 day ADR)
- Align Trade Expectation to the 5 Day ADR.
- Once Trade Entry - Stalk ADR Objectives.
- Blend Time of Day & Price Theory.
- Anticipate Profit Objectives Near ADR.
- Expect 1500-1600 GMT & ADR Convergence (& Other Technicals) Confirmation Profit Taking Objectives.
What is the Entry Concept?
- Focus on Optimal Setups.
- Apply Power of 3 & Range Expansion.
- If Bullish - Anticipate Banks to Sell First.
- If Bearish - Anticipate Banks to Rally First.
- Exploit the Raids of Old Swings & Expect Pattern to Form to Confirm Entries.
What is the Profit Objective?
- If ADR is 100 pips - take Profit at 80 Pips.
- Always Look to Scale Out of Trades.
- ADR Does NOT have to be fulfilled.
-- Be looking for something Technical for you to get out. And having Profit Objectives eliminates the Greed. --
- Develop the Profession Mindset In Targeting.
-- Have a Road Map & Contingency Plan, WRITTEN OUT. --
--- Preservation of Capital is the FIRST PRIORITY of your trading. --
- You HAVE to leave Greed out of the Process.
What is Profession Order Placement?
- Try Keeping Entry & Exit to Limit Orders.
- Market Orders Are Last Ditch Protection.
-- You will Miss Trades. That's not a Problem.--
- Do NOT try to get the Best Entry Price.
-- 62% Fib + Spread is a common ICT Entry. --
- Do Not Try to Exit on the High or Low.
- Always Factor the Spread: 2-3 Pips.
Let's look at some Charts!
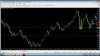
Fiber in August 2012. Monthly Chart, outlining the Range. Pic #1.
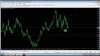
Picture #2: More viewing OTE retracements... on Monthly Charts. I hope the pictures work.
Has ICT ever done a 5 hour Pivot Teaching? He's always concerned about Pivots going that long...
Market Structure: Looking at Potential Extension Ranges. On ALL levels. This is the "Boxes" exercises.
Inside the Range: Fib Retracement as Entrance/Exits within Range Highs & Lows. Do not need any direction premise for this work.
The Initial Move out of the Asian Range is the counter-trend of day, normally.
Picture #3: Good old Judas Swings.
Never get so Zoomed in that you forget where you are Within the Higher Time Frame Ranges.
Larry Williams for more Market Structure.
Refresh of the "Ridiculous Pip Haul" teaching: Trading in the New Trend after a Swing point creation.
Not trading every day is a good thing. Using Range Concepts, you can trade the Majors Tues/Wed/Thursday.
15 Minutes of Q&A, and it only took 30 minutes.
If the Asian Range is more than 40 pips, expect an OTE or ICT Reflection Pattern to happen within the Asian Range.
News will provide the Judas. Don't fear news, anticipate the action that will happen then.
ICT watches a lot of Markets & has a lot of Monitors. But he's really focused on Daily, 4-hour, 1-hour and 15 minute charts for Cable, Fiber & USDX.
Market Symmetry tends to break around Christmas, Easter & Late Summer. Dollar & Bonds behave differently.
eSignal for his main feeds. Not sure if he still does.
Apparently Houses with White Picket Fences have dogs that want to bite chunks out of you.
July 2012, ICT got 822 e-mails.
PipHanger shout-out!
Do the Work on the Higher Time Frame Chart. It's always right there.
Attachments
ICT mentor video:
Combine this with weekly dealer ranges, daily dealer ranges for precision entry
The only indicator I trust is the Larry Williams A/D
Combine this with weekly dealer ranges, daily dealer ranges for precision entry
Attachments
Hopiplaka said:ICT mentor video:
Combine this with weekly dealer ranges, daily dealer ranges for precision entry
How do i incorporate that indicator? i would like to try it to...
Not sure where to find it,
thanks
GdayFx said:How do i incorporate that indicator? i would like to try it to...
Not sure where to find it,
thanks
It is something I created after watching the video, he said he couldn't find one for MT4, it's in his other trading platform.
Not sure if this is the same, it follows the LW rules and includes volume, something ICT said to not trust on MT4
")
You can get it here: https://dl.dropboxusercontent.com/u/307602/fx_indicators/_ICT_AD_LW.ex4
Hopiplaka said:Weekly ranges together with LW AD for USD.
See how these ranges get respected...
I'm confident you can see the 4H order block and OTE zone, I do not want to clutter the screenshot
So why don't we take this a step further
ICT said the first days of the month only daytrades, until NFP. You can "see" what they are up to.
For me, it was difficult to "see" it. Until now: Behold the Monthly dealer range
Attachments
That's the idea behind the power of 3 yes, i.e. a Judas swing on a monthly levelTarri said:So should I interpret this as the 1st 5 days are 'countertrend' for the month i.e. it runs up from the monthly open in the first days which means there is a high probability for it to return (and cross) the monthly open?
Tarri said:So should I interpret this as the 1st 5 days are 'countertrend' for the month i.e. it runs up from the monthly open in the first days which means there is a high probability for it to return (and cross) the monthly open?
Big Orders seem to pend at specific times of Months and the Year, but quite a lot of things are "valued" at Month/Quarter/Year Close. So it starts from the Close Price. (An entire Quarter was valued within 20 pips last year in the Yen, for instance, but it obviously didn't stay there.) What happens next is lining up all of the major Orders for the Month, plus the expected Fundamental Aspects. Each pair operates a little differently (major Orders pend at different times), but, for the most part, it's simply the "Power of 3" in action.
To go Down, they have to go Up first. And Reverse. When the Market doesn't have any Fundamental directions, then it's Side-ways (so Waving through the Open).
Thanks, got it. Will follow this concept in June.
If I understand correctly, following that concept + 3 std fiber might have put in the low for the month and reverse higher towards the open. Up day tomorrow would confirm through power of three.
Any wisdom to share regarding cbdr size and what to expect on the next day?
If I understand correctly, following that concept + 3 std fiber might have put in the low for the month and reverse higher towards the open. Up day tomorrow would confirm through power of three.
Any wisdom to share regarding cbdr size and what to expect on the next day?
Problem with CDR "size" right now is that volatility is so low, the numbers probably won't Hold in the future.
But, "really tight" CDRs mean a very high potential for a Big Move. I study in the USDJPY, and it's under 7 pips, I'm expecting a fairly large move.
A big trend Day can hit 9-10 CDR levels. Those are very rare (on the Cable, over the last decade, apparently less than 3% of all days), but they do happen.
proximitymines
Well-Known Member
Hi is there a comprehensive list of ICT videos somewhere especially the market reviews and live sessions? Thank you.
proximitymines said:Hi is there a comprehensive list of ICT videos somewhere especially the market reviews and live sessions? Thank you.
ICT has a web site where you can actually find a few links that work. (Saying ICT's website is "a work in progress" is like Noah saying "it looks like rain.") The links that work are well worth checking out. Don't neglect the ones to his silent videos, they're a great place to start. This is the place: http://theinnercircletrader.com/
Then there is YouTube. https://www.youtube.com/user/InnerCircleTrader/videos?view=0&flow=grid&sort=dd
Take your time, take notes and you can learn quite a lot.
proximitymines
Well-Known Member
How about the live sessions? I've watched most of the ones from youtube and ict's website.