
You are using an out of date browser. It may not display this or other websites correctly.
You should upgrade or use an alternative browser.
You should upgrade or use an alternative browser.
ICT Advanced Price Action Trading Concepts
- Thread starter TheInnerCircleTrader
- Start date

sqa said:http://theinnercircletrader.com/videos/ICT_Mentors.mp4
Hi Sqa, a friend of mine sent me an movie file .m2V have you any idea how i can play this in windows media, on W8.1 ? i can play it on my old XP...
EDIT - Actually its ok, my other windows 7, does not play it either, not sure what goes on
Dan
ps: this has nothing to do with the link you shared here
sqa said:And, if anyone is thinking it, did I just post notes from 6 hours of ICT talking today?
Why, yes I did. After I went through the process of converting both videos, I then watched them and took notes. That's about 10 hours of note taking. The start of the 20 pip teaching actually took nearly 3 hours to take notes for the first hour. ICT was dropping knowledge bombs.
Also, hit up the Feedback Email for Michael. He wants this stuff.
Thank you bro Sqa, I appreciate your efforts, once I tried, it takes long time but you can learn many thing those we usually overlook. You remind me Clint of babypips, he made the Glossary of ICT, I don't know whether babypips has that page still on or not but for me I saved a copy, here is a few screen shot of 1st page......
Edit: here is the link I found, it's very helpful for Newbie....
http://forums.babypips.com/newbie-island/49172-glossary-ict-terms-abbreviations.html
Attachments
Yeah, I keep a copy of Clint's definitions around. I think I know all of them, and Michael has shifted away from calling Pairs by acronyms, mostly. I probably need to think of starting an addendum in the future. Maybe while ICT is gone over part of the Summer, I'll think about it.
Though I'm not really sure how much he's actually added, as far as terminology. Central Bank Dealer's Range (CDR) & Order Block really seem about it.
Though I'm not really sure how much he's actually added, as far as terminology. Central Bank Dealer's Range (CDR) & Order Block really seem about it.
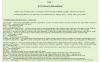
Live Stream notes 2014-05-14
727 Registered to Join... we might kill the system.
But, it's being recorded!
2 Hours intended. Let me get a tent & sleeping bag, this is going to be a long one.
Start around 6:30
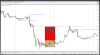
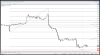
Pic #1 - Fiber
Quick overview of Fiber, Cable & USDX.
Next Stage: Over-the-Shoulder exercises. DEMO EXERCISES ONLY!
Focus on getting past the Pitfalls of when you shouldn't take Trades.
Fiber - Cable hasn't wanted to follow the Fiber lower, but that finally changed today.
Fiber speech/news tomorrow, so sorting out the Price Action for a bit.
Right now, it's an opportunity to do... absolutely nothing. But what do we do when setting up for the next move, after the news?
Lining up the Order Block from May 13.
Lethargic pair going sideways. Potential "bear trap".
"Speaking ahead". Because of where we are at right now, there's nothing to key off for a trade entry at this level. Could very much break both ways on whatever trade you take.
He bought a mouse! Just hasn't set it up yet... getting there!
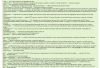
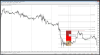
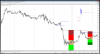
Pic #2 - Cable
Quick review of the Cable trade.
"Selling Rallies" is a Text book thing you're supposed to do, but no one really does it.
To Steve: "I can see the Judas after it happens, but I can't see how far it will go."
CDR helps you zone in on the Judas ranges.
Session High/Lows; Day High/Lows; always sensitive levels.
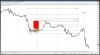
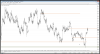
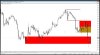
Pic #3 - See where we are "Within The Range".
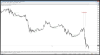
CDR Graph Standardization Please: See this Picture #4. "Tan" for the Middle, Bright 1 STD, Darker 2 STD.
Want to see an Overlapping of an Order Block & 62-79% Retracement.
What happens within the CDR and why the standard deviations:
- We know nothing moves in a Straight Line.
- They'll pump up volume, make it look like it'll breakout.
- Heavy moves are defended by massive money.
- Market Makers setup the Potential moves.
- They adjust price into the direction where they don't have any orders to fill. (I might have typed this one wrong...)
A Fractal is *any* pattern that happens on any Time Frame. Order Blocks act as Fractals as well.
Picture #5 - Higher to Lower OTE patterns/Order Block patterns.
When you "look at the Charts", don't just get into them looking for your next Trade.
CDR is "quiet", unless there is a FOMC/Interest Rate announcement.
In a bearish market, and you anticipate the market to set a lower high: If it drops out of the CDR at the start, at least 1 STD, it will Judas back to the other side. If it doesn't break out of the Range, it'll go 2 STD up.
You want to be looking where Price reacts Strongly. Retail doesn't move the market, thus the Institutional Traders are tipping their hand.
Rich's Question: 1-2 weeks of good reading of the chart, but the trade goes his way. Then he jams his SL up to break even and the trade pulls back and closes. But he doesn't take the next trade because he's angry.
ICT's response: When you take the next trade, you have to adjust your Risk & expectation. When the "Gambler" gets in control, close the charts and walk away.
You take the next Trade, but you have to drop your Risk.
You *HAVE* to have a very rigid approach to your Rules. You have to keep to them.
You have to Find where your Weaknesses materialize.
This is learnable, but you're not going to get to that level for a LONG time. ICT is still learning and refining his Exit Strategy, and he's been doing this for 20 years.
News bring volatility. ICT doesn't trade the news.
Back to Cable: Once Monday's Low was broken, we're looking at a down run.
MT4 trick: Make a box, then Ctrl + Click the box and drag it.
How do you get in?
How ICT Trades Bonds: HTF S&R, Power of 3...
Rabbit Trail: Only 6-7 more did the Homework. He's a pretty deflated by not a lot more. If you are, do tell him.
You *have* to do the work. There's no way around it.
He'd love if it was easier! It's not! /trail end
Back to Bonds...
ICT got margin "called", a lot, actually. 50k-60k a day... in losses. For weeks.
OOPS pattern, futures or bonds, especially over a S&R.
We're getting the "Real ICT". He's a bit aggressive.
Pattern & rules around a trade don't change, but a Trade is done & gone after it's over. You can't do that trade again, BUT you can learn so much from it.
Significant losses will ruin you physically.
If you can't put in the work, keep control of yourself, then you're just Daydreaming. Then this business isn't for you.
As a Professional Trader: you want your Risk to be the SMALLEST IT COULD POSSIBLY BE!!!
Going into a Trade, you want to think "how low of a Risk can I get into this trade, without being taken out by Static?".
View CDR: As Day Open.
Back in Bonds: ICT would study the 30, 10, 5 & 2 year Notes. When the Lows would start diverging, he would buy that, at the low, then it would go up. (On an expected Up-day)
10 minute break at the 1h:50m mark.
Back to Bonds: He used his Bond Analysis to figure out how to handle the daily premise in Cable/Fiber. Before the recent decoupling.
------------------
SPOOS? SP500. Teaching still there.
Dow Jones, S&P-Cash, NASDAQ Comp Charts:
- Bullish or Bearish Frame Work.
-- 5 period Williams %R.
- Looking for Divergence from the Opening Move.
Morning Trend; Stop & Pause (lunch); 2 pm Afternoon Trend.
- Continuation
- Reverse
- Move back into the Range
AUD and S&P correlates highly.
-------------------
Everyone else places Stops @ Highs & Lows. So we know where all the Stops are.
We view the initial move as "Suspect Price Action". That's the Judas.
After time, you won't need to place the CDR boxes, you'll just see them.
WE APPRECIATE IT, ICT!
Reason for the 30 pip Stop: The likelihood of being taken out from 30 pips is very low. Can be, but it's highly unlikely.
Only takes 1 trade to Print, to trip all of the Pending Orders.
ICT waits for the confirmation pull-back to take them. It takes guts to take a lined-out, called Swing point.
You don't want a "chunk" of the market. You want to be a Surgeon: precision cuts of the market.
LONDON OPEN SETUPS DO NOT HAPPEN EVERY SINGLE DAY!
BUT THERE ARE 2-3 EVERY SINGLE WEEK!
If you don't trade London? Don't beat yourself up. Yes, you can only trade New York or Asia. You'll lose a lot of the Daily Range, but you just need a consistent piece of the market to make a career.
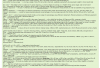
CDR Tools:
- Lay out 1 & 2 STD
- Where are in the Range?
- Where are the Previous Highs/Lows?
- Where are the Order Blocks?
- Pull Fib on the previous Day's Range.
Move that happens After 500 GMT is the Judas setup.
You'll get a strong reaction at 3 STD going into LO.
Killing Ground - Based on Price
Kill Zone - Based on Time
This part gets Hard: If ICT sees a level that's highly sensitive, but just outside the Kill Zone. Need to wait. It'll get back there.
A Continuation pattern from 10-12 GMT, is why you need some room in the Stop Loss.
Pic #10 - USDX
Hey, look at those levels laid out weeks ago.
3 hours in
Next Stuff!
ICT gone for June. Totally gone. No Twitter. He swears. /I give it mid-June.
Webinars from July: No commentary. Just chart work. We'll print charts. Top Down analysis. Every day before London, he'll be tweeting 1 pair he's on.
1 Full Month of this.
August: Weekly Setups for the Week. No discussion after that.
September: Short-term trades. 2-3 day holds. (Hopes volatility will return, otherwise it's a problem)
October: 5 days a week: 20 pips per day! But we're not going to make it, but we'll work on it for a month.
November: Stocks & Commodity.
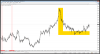
Pic #11 - L-Range example.
7-Range comes off Low.
3h:15m to 3h:20m in for today. Not too bad.
Attachments
The other images. I didn't actually list #9 in the notes, but it's a picture of what ICT wants CDR to be shown as. Eventually, you won't need to do that, but, seriously, do it daily for at least a month.
Attachments
Again, thanks for the note taking sqa.sqa said:The other images. I didn't actually list #9 in the notes, but it's a picture of what ICT wants CDR to be shown as. Eventually, you won't need to do that, but, seriously, do it daily for at least a month.
I have uploaded an indicator I've created to draw the CDR.
If you want to use it, head over to http://fxgears.com/forum/index.php?topic=320
TheRumpledOne
IT'S NOT WHAT YOU TRADE, IT'S HOW YOU TRADE IT!
sqa said:http://theinnercircletrader.com/Videos/05_14_14.wmv
Sqa, thank you for all the work you do in keeping us posted.
Live Stream 2014-05-15... 
I hope someone has some notes of anything interesting ICT said. He said there wasn't going to be one, so I was out doing some work. Got back in and saw it was going. Yeah, I made 5 minutes.
I'm WAY late to this. But there wasn't supposed to be one.
Eat better. There's a lot of stress in this!
Not sure what Pic 1 was outlining.
I hope someone has some notes of anything interesting ICT said. He said there wasn't going to be one, so I was out doing some work. Got back in and saw it was going. Yeah, I made 5 minutes.
Attachments
saeedzaman
Well-Known Member
did ict record today's live session?
saeedzaman said:did ict record today's live session?
He said it is recorded except the Q&A session.
syzygus009
Well-Known Member
The funny thing is in todays Q & A sessions is where i had a light bulb moment....
it wasnt recorded
it wasnt recorded
TheRumpledOne
IT'S NOT WHAT YOU TRADE, IT'S HOW YOU TRADE IT!
What was your LIGHT BULB MOMENT??
syzygus009
Well-Known Member
The Jade in the MM Business Model.
syzygus009 said:The Jade in the MM Business Model.
Quick, write the summary down here before the lightbulb switches off
(and we can also harvest the Jade
)