the golden gun
RINSE & REPEAT
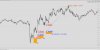
This is a personal case study, from Fiber's Post NFP trading. 1M chart.
Red labels = 3 Entries (added to winning trade only)
Blue labels = position average price
Blue X = trailed SL on position average price
Risk starts at 1% for first entry. Increases to 1.5% for 2nd entry. Remains at 1.5% following 3rd entry.
Specifics of this case study are not important, and completely made up. It is an example of a process using real price action, and realistic quality of execution. Enjoy!")
Red labels = 3 Entries (added to winning trade only)
Blue labels = position average price
Blue X = trailed SL on position average price
Risk starts at 1% for first entry. Increases to 1.5% for 2nd entry. Remains at 1.5% following 3rd entry.
Specifics of this case study are not important, and completely made up. It is an example of a process using real price action, and realistic quality of execution. Enjoy!