
You are using an out of date browser. It may not display this or other websites correctly.
You should upgrade or use an alternative browser.
You should upgrade or use an alternative browser.
ICT Homework Thread June 22nd-July 4th
- Thread starter Tansen
- Start date
- Status
- Not open for further replies.
Re: ICT Homework Thread June 22nd-27th
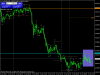
AUDUSD - do you consider this a break of MS?
It runs up into resistance (previous support) and makes a low followed by a second lower low. Wondering if this qualifies. Took the short from .9367 which is 61.8 retrace from previous high on 15m TF.
Edit: it is 15 mins before USD news release i.e. maybe not the best time but let's see
Attachments
Re: ICT Homework Thread June 22nd-27th
So maybe it wasn't (stopped). Does look like retest of .9388 high.
Cable long from 1.6957 working though
Tarri said:AUDUSD - do you consider this a break of MS?
So maybe it wasn't (stopped). Does look like retest of .9388 high.
Cable long from 1.6957 working though
Re: ICT Homework Thread June 22nd-27th
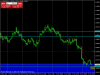
Couldn't find much on USDCAD tweet from Michael around 1.0750
Couple of things I do think I see here:
1) USDCAD hovering above support 1.07 area
2) There's a daily buy order block we are entering (in blue)
3) Could do a reflection pattern to pick the bottom (brown smaller box)
4) It is at the 79% line from 1.0566 to highs
Attachments
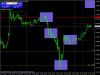
Re: ICT Homework Thread June 22nd-27th
I think he meant we could've sold at 1.075
A reversal tomorrow would be nice")
Tarri said:Couldn't find much on USDCAD tweet from Michael around 1.0750
Couple of things I do think I see here:
1) USDCAD hovering above support 1.07 area
2) There's a daily buy order block we are entering (in blue)
3) Could do a reflection pattern to pick the bottom (brown smaller box)
4) It is at the 79% line from 1.0566 to highs
I think he meant we could've sold at 1.075
A reversal tomorrow would be nice
Attachments
Re: ICT Homework Thread June 22nd-27th
Brings me to the topic I don't completely understand. It looks like USDCAD breaks market structure after that bounce meaning we could be in for a reversal.
But as my AUDUSD post from this morning shows, this MS is somewhat elusive still for me.
Brings me to the topic I don't completely understand. It looks like USDCAD breaks market structure after that bounce meaning we could be in for a reversal.
But as my AUDUSD post from this morning shows, this MS is somewhat elusive still for me.
Re: ICT Homework Thread June 22nd-27th
I'm not so good at following steep trends (or at english )
I allways wait for price to retrace deeper. Looking at your picture with the AUDUSD, I would've traded short only up near previous day's high, at 0.9400 or 0.9420, not at the bottom of the range.. if you watch the 1H chart (0.9444-0.9320).
The price would've likely stopped going down beyond the june 18th consolidation.
For market structure, I watch for the bigger swings to be broken, the ones I see easily without the fractal indicator (1H chart maybe), and then I watch on the left side to see if price has room to move or could pause or reverse in some kind of consolidation or key s/r level
The difference between market structure broken and fakeouts, I still find it difficult to see..
I'm not so good at following steep trends (or at english
)I allways wait for price to retrace deeper. Looking at your picture with the AUDUSD, I would've traded short only up near previous day's high, at 0.9400 or 0.9420, not at the bottom of the range.. if you watch the 1H chart (0.9444-0.9320).
The price would've likely stopped going down beyond the june 18th consolidation.
For market structure, I watch for the bigger swings to be broken, the ones I see easily without the fractal indicator (1H chart maybe), and then I watch on the left side to see if price has room to move or could pause or reverse in some kind of consolidation or key s/r level
The difference between market structure broken and fakeouts, I still find it difficult to see..
Re: ICT Homework Thread June 22nd-27th
I'll run together everything a bit later, but this is "this weeks" work. Though this is mostly just in case I don't delete it like I tried to last week...
ICT Homework - Week 4
#2:
Monday: 2:00 EDT/6:00 GMT
Tuesday: 3:30 EDT/7:30 GMT
#3:
Wednesday: 3:00 EDT/7:00 GMT & 4:15/8:15 (Identical on my feed)
Thursday: 3:15 EDT/7:15 GMT
#4:
Low: Wednesday, 3:00 EDT/7:00 GMT & 4:15/8:15
#5:
High: Thursday, 23:45 EDT / 3:45 GMT
#6:
Monday, Tuesday
#7:
wednesday, Thursday
#8:
Monday: 8:30 EDT
Tuesday: 12:15 EDT
#9:
Wednesday: 8:45 EDT
Thursday: 8:45 EDT or 23:45 EDT (something weird that Asian Session)
#10:
See Picture.
#13:
100 Pips on the week.
#14:
Monday: 46%
Tuesday: 66%
Wednesday: 52%
Thursday: 82%
Friday: 39%
Attachments
Re: ICT Homework Thread June 22nd-27th
Here's my data.
Since none would be able to read my handwriting I re-did the thing digitally.
Please allow for a nice margin of error, as I was fighting a mean flu these past few weeks.
I don't see, at this point, if I learned anything drastically new from this exercise.. but it did proof many of the things ICT has taught us these past few years about killzones and Tuesday-Thursday having the biggest likelihood for nice moves..
edit:
I can't seem to get my attachments posted... how do you guys do that?
edit2: agh now I got it
Attachments
Hopiplaka
My thanks go out to ICT - the life changer
Re: ICT Homework Thread June 22nd-27th
sakib717 said:whats happened in cable ? really weird to me...................can anyone explain it ?
Attachments
Re: ICT Homework Thread June 22nd-27th
thanks Hopiplaka but i was wondering usd index in support and this swing will weaken in 162 %
so i was targeting 50 level for sell, also CDR 3 STD were there..... i was expecting to go lower but its growing higher ! you know why its happening ?
thanks Hopiplaka but i was wondering usd index in support and this swing will weaken in 162 %
so i was targeting 50 level for sell, also CDR 3 STD were there..... i was expecting to go lower but its growing higher ! you know why its happening ?
Hopiplaka
My thanks go out to ICT - the life changer
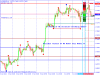
Re: ICT Homework Thread June 22nd-27th
Unfortunately I cannot answer that one
My goal is to go with the flow, so I'm not trying to pick tops/bottoms anymore. I've burned myself way too much in the past doing that
So I just go with the 9/18 ema in most cases. This was a nice example, Wednesday low, order block, ote area, ...
Hi Sakib717,sakib717 said:thanks Hopiplaka but i was wondering usd index in support and this swing will weaken in 162 %
so i was targeting 50 level for sell, also CDR 3 STD were there..... i was expecting to go lower but its growing higher ! you know why its happening ?
Unfortunately I cannot answer that one
My goal is to go with the flow, so I'm not trying to pick tops/bottoms anymore. I've burned myself way too much in the past doing that
So I just go with the 9/18 ema in most cases. This was a nice example, Wednesday low, order block, ote area, ...
- Status
- Not open for further replies.