One of the things ICT was going over in his two live sessions this week had dealt with using a Daily Chart in a Monthly view.
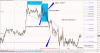
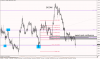
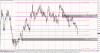
Basic design is: Use a OHLC D1 chart of the pair. Trendline the Month Open for the Month. Then box highlight the first 4 trading days. (I'm attempting to do the days before NFP, but I can't find a full list at the moment, so doing it manually.)
This bridges off the Power of Three concept (which I need to review myself). If it's an Up month, the work will be normally done before NFP below the Month Open. If a Down month, work is done above. Exceptions seems to be if the pair is taking off from where it started the month, then it's likely up for most of the month.
However, that Month Open is a huge "pull to" location for the final week of the month. If you see a OTE retracement level on a Monday of the final week of the month, you could easily see a specific run back to the Month Open level.
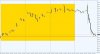
In other news, Currency pair Month Open/Close levels are perfectly natural occurrence that have nothing -- truly nothing -- to do with valuations for other asset classes. There is no way that a Pair can range +/- 300 pips from it's Month & Quarter open level and keep returning there at each successive Month Open by any other means than random happenstance.
(In even more other news, I think I found Big Foot)
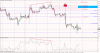
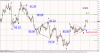
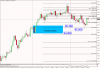
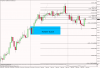
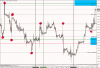
On the USDJPY, my read is for the NFP to drive up to at least 105. There is only liquidity above it currently. Market Structure is on a 2 Month upswing break, and it's been headed towards those upper liquidity pockets for 3 weeks now. It's hovering above an S&R with nothing below it to grab. It would need to move down 100+ pips to hit an Order Block with much action in it.
Not sure if I'll be able to get into position properly, but we'll see.