You are using an out of date browser. It may not display this or other websites correctly.
You should upgrade or use an alternative browser.
You should upgrade or use an alternative browser.
ICT Advanced Price Action Trading Concepts
- Thread starter TheInnerCircleTrader
- Start date

sqa said:Most recent version of ICT tools I have.
are these for mt4
Well Bloomberg or Reuters is the usual go to but for a direct feed costs money.
I'd stick with Forexfactory or myfxbook which has a more "comprehensive" one but that could just mean a ton of useless releases. It gets in to detail about the smaller ones like Norway, Ukraine, Swedish numbers etc. Not of huge relevance since the main focus of the Euro pair is either the big problem cases like Greece was or the heavy hitters like Germany.
I'd stick with Forexfactory or myfxbook which has a more "comprehensive" one but that could just mean a ton of useless releases. It gets in to detail about the smaller ones like Norway, Ukraine, Swedish numbers etc. Not of huge relevance since the main focus of the Euro pair is either the big problem cases like Greece was or the heavy hitters like Germany.
DrFeelgood
Active Member
Hi, where is ICT posting his recorded daily videos please. Thanks
DrFeelgood said:Hi, where is ICT posting his recorded daily videos please. Thanks
HopefullyTM today's will be up tonight. He does have a few days recorded, but a few of them not much all that interesting happened. One of the days that is recorded has insanely small text, so it's 5.5 hours of squinting, as ICT said.
Today's, however, will have audio and be WELL worth it.
Would you happen to have a short outline of what was told yesterday? I was unable to join unfortunately.sqa said:HopefullyTM today's will be up tonight. He does have a few days recorded, but a few of them not much all that interesting happened. One of the days that is recorded has insanely small text, so it's 5.5 hours of squinting, as ICT said.
Today's, however, will have audio and be WELL worth it.
Host@All: now notepad
Host@All: Delaers Range is 18 GMT to 0 GMT or new day
Host@All: Dealers Range rather
Host@All: our Asian Range is 0 GMT to 5 GMT - which is essentially New Day start to NY Midnght hout
Host@All: hour
Host@All: 0 GMT
Viewer 111@All: what dealers do in 0to 5 GMT then?
Tar@All: ok, I'm with you
DrFeelgood@All: k
Host@All: thats the Central Bank of Japan setting the London premarket highs and lows
Viewer 111@All: green one?
DrFeelgood@All: Nippons !!!!!!!!!!!!
Host@All: each session is driven by a respective Central bank... during London it's a free for all
Host@All: Central Bank Dealers will move price to resting liquidity
Host@All: this is a nice way of saying your stops
Here's the video link: http://theinnercircletrader.com/videos/Central_Bank_Dealers_Range.mp4
If anyone cares about the utility here:
Took my first trade with the new insight. It was an Order Block Inception: H4, 3x H1, just above Dealing Range of the Day and back into 2 previous ranges. I'm glad I lowered my Limit by 1 pip, as the Short might not have tripped otherwise.
Closed 1/2 of the position 90 minutes later at 41.7 pips profit. I'd say that's pretty good for an order idea I had the day before.
Kuzia said:Sqa i was long today and lost my 20pips. Why would u short if MS wasnt broken to the down side u was just basing ur decision on 4h order block? What aboutany s&r lines do u use them?
Go to the D1 Chart, pop up the Fractals. We peaked going into Japanese CPI tomorrow/tonight US time. Weekly peak was Tuesday, though they might clean those stops tomorrow. If you look at Feb & March, notice the ranges they got stuck in. We're right there. If it was going higher, it would have keep running.
The entire USDJPY pair is actually in a "Sell Program" starting at the beginning of the year. So sell-offs should happen faster than bullish runs.
There's also the little issue that next week is "Golden Week", so pretty much every Japanese Financial institution will be closed. There's a repeatable, historic price run down going into that Thursday/Friday.
") In other news, I'm not trading Yen next week.
In other news, I'm not trading Yen next week.Edit: I'm attaching the chart that's roughly how I used it. The Thick Yellow Line is the H4 Order Block Candle's Bottom/Major overlap areas. The trade happens in NYO (I call the USDJPY traders in NYO the "New York Raiders"). There were several Buys to take over the last few days, but we were at a shift in the market, which is why I was hunting Shorts. I overslept and missed yesterdays.
Attachments
Kuzia said:Lol sorry i was speaking about Fiber
18:00 GMT to 23:59 GMT.
sqa said:18:00 GMT to 23:59 GMT.
Yes they work that time i understand. But what information does it give to us ?
Live Stream 2014-04-24 Notes
I'm not sure if ICT recorded today's session or not, but here's some notes I took.
Since ICT was fighting the Beast from the Cave of Caerbannog of Rabbit Trails with the last part (which ran roughly 2+ hours after he wanted to end the webinar), I'll explain what he was up to. This is also what he did when he solo-mentored people. One of which (Gate) showed up Wednesday. Who, it should be noted, has made legitimate bank with ICT's teaching.
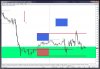
So, the Dealer's Range Chart Exercise, which goes with the video posted this morning goes like this:
The Attached picture is how ICT was highlighting the functionality. You take the Dealing Range (1800 GMT to 2359 GMT) and replicate the Boxes to the Top & Bottom. This forms the Dealing Range & 1 Standard Deviation top & bottom.
This is where the "Power of Three" concept operates from. The picture is this analysis on the Pound-Franc, as ICT asked for a random pair to do analysis on (as it works on all of them). Someone typed that first.
Second Exercise:
Sub-section topic he ended up hitting on for a while:
Review the Price Action series from this weekend, especially the "L7 Range". It came up during the Pound-Franc analysis, but it's really helpful in properly framing the more functional Range. Just pulling a Fib doesn't mean much. It's *where the Order Block* is within the Fib. An area with a heavy Order Block is the previous Swing to to be most mindful of.
Knowing how to choose Order Blocks is a skill that takes work, which is why it's lost on so many. Which is why ICT wants Homework posted.
I'm not sure if ICT recorded today's session or not, but here's some notes I took.
On Trade Setups/Ideas that are highly likely:
- Mark Key Levels
- Wait for Reaction
- Wait for Order Block to be gone back to *during* a Kill Zone
(Level, Response into Time & Price; That's the Order in which you deal with trade setups. You "fit" the trade idea to what the Price is giving you, not the other way around)
When trading to a Big Figure, expect some momentum past it. (Big Figures, 00 & 50, have a lot of orders booked up, so the longer it's been away from a level, the more momentum to expect past them. Really KEY if you're placing a Limit at one)
"Street Smarts" referenced again. Taking trades inside a consolidation is an almost sure-fire loser.
If Price, going into London Session, goes into the previous day's Order Block: where is the Highest Likelihood Price it will turn at.
You have permission to lose... just not more than 2%.
The Price goes to where the Majority of Money is to be made.
What happens at 5 GMT? First major move is where the Money is.
90% of all losses came from taking a trade during a consolidation.
Use Dealing Range as Box, Copy High & Low, as a 1 Standard Deviation Trading Range for the day.
1 Chart per day.
Since ICT was fighting the Beast from the Cave of Caerbannog of Rabbit Trails with the last part (which ran roughly 2+ hours after he wanted to end the webinar), I'll explain what he was up to. This is also what he did when he solo-mentored people. One of which (Gate) showed up Wednesday. Who, it should be noted, has made legitimate bank with ICT's teaching.
So, the Dealer's Range Chart Exercise, which goes with the video posted this morning goes like this:
- 4 Weeks of *just* watching Price Action, in real time, from 5 GMT to 8 GMT (or roughly there about). The point of the exercise is not to take trades, it's to *watch* the Price Action. Watching in Real-Time ends up being key. (Any of the pro traders around can probably explain about it better)
- 3 Months of trading 20 pip gain/20 stop-loss, on demo, using the Standard Deviation Model.
- At this point, you'll start knowing what Price Patterns are forming and have a very good idea *where* to get out of the trades. (If it's a day-trade)
This is the method ICT used for solo teaching.
The Attached picture is how ICT was highlighting the functionality. You take the Dealing Range (1800 GMT to 2359 GMT) and replicate the Boxes to the Top & Bottom. This forms the Dealing Range & 1 Standard Deviation top & bottom.
This is where the "Power of Three" concept operates from. The picture is this analysis on the Pound-Franc, as ICT asked for a random pair to do analysis on (as it works on all of them). Someone typed that first.
Second Exercise:
- This is with the "Homework".
- WORK ON ONLY 1 PAIR
- Post, for 30 days (though I think he means 1 Trading Month) the Dealing Range analysis of your pair. Along with the Order Blocks within reach for that day.
Sub-section topic he ended up hitting on for a while:
Review the Price Action series from this weekend, especially the "L7 Range". It came up during the Pound-Franc analysis, but it's really helpful in properly framing the more functional Range. Just pulling a Fib doesn't mean much. It's *where the Order Block* is within the Fib. An area with a heavy Order Block is the previous Swing to to be most mindful of.
Knowing how to choose Order Blocks is a skill that takes work, which is why it's lost on so many. Which is why ICT wants Homework posted.
Attachments