shopster said:
... what do you see and where do you think it is .........?
Happy to show you. However please note that I did not take this trade and wasn't watching this market at the time. Pity really as it was an easy scalp with my method too.
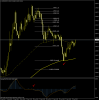
The attached chart shows my approach. It basically involves reading the price action story. I show my timing zones and I also show my buy and sell zones and proprietary MAT which basically takes the place of the Zero Lag MACD shown by Alpha-Bet. The relevant support zone is also shown.
The market rallied strongly through the Frankfurt open (which was another easy buy from the bottom using the identical method). It had a typical pull back into the buy zone for another very easy scalp. It rallied through the London open forming a new high. At this point the story is scremaing sell with a very strong MAT divergence inside the timing zone (marked).
From the high to the pullback into the buy zone formed a 20 minute range suitable for applying the Fib tool. Clearly there was no buy indicated from this buy zone pullback due to the divergence and timing, so we are looking to sell unless the high is blown away. It wasn't.
Entry is made by a pending sell order placed at the 61.8% retracement (0.9428). The chart shows some higher prints but I wouldn't be interested in those crumbs on an M5 chart and prefer a higher probability fill at my chosen price over a missed and possibly sloppy market entry if there is no higer fill.
Now we are into trade management. If scalping I would have exited all or part of my position instantly on seeing the wick on the closed candle that broke the 200% Fib level. That level is 0.9415 so take a couple of pips off that if you like for an initial exit. Now we watch and wait patiently.
The bounce entered my sell zone and I would have targeted a sell at 0.9420. As we watch the price follow the sell zone lower into the New York open zone an eye is kept on the MAT which is forming another divergence right on time. We are also entering my target zone which is the support zone drawn on the chart. Full exit for profit would have been at 0.9406 or lower.
With my method there is never any doubt about exits. I take the view that if you have no rules or consistent method for exits then you don't yet have a completed trading plan.
The market then went about resetting for yet another trade but as I can't trade 24 hours a day that would have to be left for others to take.
This is trading
not made simple but
kept simple. Unfortunately most people want to make out that it's complicated. People are complicated, trading is simple. If people weren't so complicated then trading could actually be easy!
Anyway, thanks for the question shopster. I hope someone finds this useful.


")