You are using an out of date browser. It may not display this or other websites correctly.
You should upgrade or use an alternative browser.
You should upgrade or use an alternative browser.
Scout Sniper Basic Field Guide - InnerCircleTrader
- Thread starter TheInnerCircleTrader
- Start date

marcusmcneice said:I got a quick question. I have setup the bond yield comparison chart with the 10 year US, 10 year German, and 10 year UK bond yield, as described in Episode 3. Is there a way to save that chart. I have bookmarked the chart in Chrome, but when you got back to it the German and UK yield are missing. I have to set it up each time. Is there a way to save the chart so all three come up when you go back to it?
Thanks.
Hi and welcome to the forum!
")
(just giving your post a quote so it doesn't get burried under the others)
marcusmcneice
Member
Thanks sqa. Yes i was talking about Bloomberg.... just making sure I was not missing something.
Thanks for the welcome, Jack.
Thanks for the welcome, Jack.
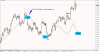
sqa said:I think the lesson, for me this week, firstly is that "News = Liquidity to move", but it rarely enough to actually change a Major pair. Secondly, the market will complete it's cycles before moving onto the next Fundamental shift.
I have been plotting the data reads calender days, onto this Aussie chart, just as an exercise for my own knowledge, seeing what price actually does around those reads. Interest rates on hold, has had an impact
Attachments
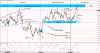
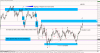
I am smelling that the AU went for a little stop run on the daily chart, and on the hourly market structure has recently shifted to the down side, i am thinking about selling into any rallies the Aussie may have, and potentially taking it down to the daily order block, what do you guys think?
Attachments
PipPimp said:I am smelling that the AU went for a little stop run on the daily chart, and on the hourly market structure has recently shifted to the down side, i am thinking about selling into any rallies the Aussie may have, and potentially taking it down to the daily order block, what do you guys think?
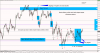
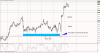
Looking at the bigger structure, the pair just spent 3 weeks consolidating. However, it looks like the first Up-Move on a Market Maker Buy Model. It's cleared out the Jan liquidity pocket at .9050; the November 2013 Order Block at .9100. There is some more Order blocks at .9150 & .9180, but the next major one is up at .9300.
On more historical analysis, .9200 is the really important number. If this is going up (I don't have a view on the fundamentals), then it'll probably jump past that level. If not, it's probably down. It also might be completing the OTE from the November 20th High to Jan 26 Low. Partially as it reflected along the 50% & 38% fib levels.
sqa said:Looking at the bigger structure, the pair just spent 3 weeks consolidating. However, it looks like the first Up-Move on a Market Maker Buy Model. It's cleared out the Jan liquidity pocket at .9050; the November 2013 Order Block at .9100. There is some more Order blocks at .9150 & .9180, but the next major one is up at .9300.
On more historical analysis, .9200 is the really important number. If this is going up (I don't have a view on the fundamentals), then it'll probably jump past that level. If not, it's probably down. It also might be completing the OTE from the November 20th High to Jan 26 Low. Partially as it reflected along the 50% & 38% fib levels.
I'm posting this Wednesday while it's hovering around .8980. At the moment, it's in the short-term Buy OTE and a multi-month Sell OTE. Wednesday reflected between Last Week's High/Low 62% & 79% Buy OTEs.
That's when the High Time Frame analysis becomes really important.
Oh, update on my head-desking on the USDJPY last week.
I settled for a News Cycle up-swing Sell. Came 5 pips from being Stopped out, but I caught it properly. Took off about 1/3rd at 42 pips; 1/3rd at 79 pips. Moved my stop up to 30 pips profit, Take-Profit at 120 pips (just before a major Retracement level on last week's move).
If I had more confidence in my full Analysis, this is actually a trade to hold for a week or two. As much as the market structure went to Bull, it was the completion of a 2 week Buy Model, yet it only ended at a OTE retracement of the Quarterly movement. Given the USDX and fundamental analysis, this pair is going back down for a while. Minus moves.
Though to bridge that good call, I managed to botch the inputs on my first GBPUSD trade. To the point that my Stoploss was what I thought my entry point was... DOH. The point of Demo trading, haha.
Question: Wednesday is the IMM quarterly futures date. Is it normally a day of pretty massive movement? (looking back over the year, it seems to be the day a big move happens intra-week) The Rollover period was Monday, but it doesn't all hit until next Wednesday, if I'm reading this properly.
I can't seem to find too much information about Forex on this topic. Oddly.
I can't seem to find too much information about Forex on this topic. Oddly.
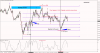
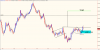
I haven't posted yet so I thought I would give it a try. Attached is a AUDUSD chart. I ended up getting in at .89492. A nice head and shoulders pattern with an OTE zone entry inside daily order block. I am currently at BE. looking for the Head and shoulders 100% ext. to .9500. This will be hard for me to not mess with and I have a very good chance of getting taken out but i really like trading this pattern on the shorter time frames...lets see if I can knock out a nice swing trade. I am currently short EURAUD on a very similar pattern.
ICT- I've been following you now for over 3yrs. I'm happy your still putting out great info. Thanks.
ICT- I've been following you now for over 3yrs. I'm happy your still putting out great info. Thanks.
Attachments
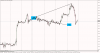
foreigner said:Bonds and USDX Diverging from eachother which makes me think EURUSD rally is manipulation.
The dollar index's look like they are setting up for launch mode
djsm8 said:I haven't posted yet so I thought I would give it a try. Attached is a AUDUSD chart. I ended up getting in at .89492. A nice head and shoulders pattern with an OTE zone entry inside daily order block. I am currently at BE. looking for the Head and shoulders 100% ext. to .9500. This will be hard for me to not mess with and I have a very good chance of getting taken out but i really like trading this pattern on the shorter time frames...lets see if I can knock out a nice swing trade. I am currently short EURAUD on a very similar pattern.
ICT- I've been following you now for over 3yrs. I'm happy your still putting out great info. Thanks.
As I said a few comments back, the .9200 is the big key. If it breaks that, your up-side objective might be most of the year off, but there's a chance to make it. .9200 is, however, a massive resistance level.