Tansen said:I think... even we need contrarians to our contrarian views of the markets lol.
Are you saying you are a bear or a bull?
Tansen said:I think... even we need contrarians to our contrarian views of the markets lol.
slugFX said:Are you saying you are a bear or a bull?
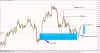
Hopiplaka said:This is my take on it:
Market Maker Buy program completed on the 4H
Failure Swing on the 1H
Divergence in stock market, some failed to make Higher High
Bonds bounced off off the OTE zone and continue to go higher=lower yields=lower foreign currency prices.
So I'm bearish today. I'm considering 1.3760 to be a resistance point, TP 1.3535-1.3560 level (might not come this week, maybe early next week?)
Tansen said:I'm saying Potato.
or you could stay flat lol
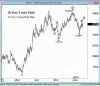
GdayFx said:My Technicals on the 10 Year T note yield Daily chart, is for it to head to 2400 late next month
foreigner said:Where do you get the yield charts m8?
Yes, 75 pips, all thanks the the MM model on the 15Min/30Min chart.GdayFx said:You were on the Money! Long term could be setting up...
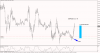
I'm not a COT person (yetjinirav75 said:I also shorted at 62.1% level OTE (1.3733) and I see it as a new MMP sell model aiming it's retracement to 1.3480 level. USDx is at OTE buy level too which is a nice confluence.
Here is my thought, market structure broken to the downside when the price hit 1.3480 level and possibly this price move up is a suspect rally and more down side is in the working?
Those who are watching the COT, seasonal tendencies and open interest share their thoughts here please? Thank you.
") ) but seasonal tendencies and divergence between stocks/bonds on the medium to longer term (quarter) predict lower foreign currency prices/higher USD as far as I'm concerned.
) but seasonal tendencies and divergence between stocks/bonds on the medium to longer term (quarter) predict lower foreign currency prices/higher USD as far as I'm concerned. Hmm, a 90 pips weekly range for the fiber? I think we might see 1.3630 before the end of this week. We still have the home sales and a FOMC member coming up to provide some fuelKuzia said:I dont think this week anything gonna happen, no gas left in the tank. But for next week ill be watching 1.3740lvl and im 99% sure that its gonna be ITH looking at COT + diverging stocks kinda gives more weight to it
jinirav75 said:Those who are watching the COT, seasonal tendencies and open interest share their thoughts here please? Thank you.
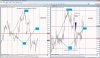
foreigner said:Large Specs are net short commercials have reduced Longs.
Open interest has risen substantially with market in a large range 13500-13900 indicating short positioning.
Given the recent stop run and technical confluence it looks bearish to me.* it could still make a new high
jinirav75 said:In one of the Videos, ICT states "when we see a large increase or decrease in open interest, this means commercials adjusting their positions (hedging?). Can this be explained in detail, possibly with some charts please. Thank you.
GdayFx said:This is delivered to me 3 times a week from my subscriber, note the address on the bottom of pic, where they would receive the chart from, id say