
You are using an out of date browser. It may not display this or other websites correctly.
You should upgrade or use an alternative browser.
You should upgrade or use an alternative browser.
Scout Sniper Basic Field Guide - InnerCircleTrader
- Thread starter TheInnerCircleTrader
- Start date

goodpunk6 said:My long from this morning. Took 70% off at +20. Stop to BE+1
Just took some more off at +60. Still got a bit.
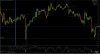
ovidiux said:has anyone taken that move on fiber? and how? I was long, expecting to retrace at 1.3650 area :-[
I was hunting short all week this one paid off at 1.35221, I could of gotten a slightly better price at 1.35246 but.... I was too lazy to drop down to a 5 min chart.
brians1128
Well-Known Member
ovidiux said:has anyone taken that move on fiber? and how? I was long, expecting to retrace at 1.3650 area :-[
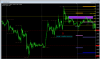
market structure was bearish so you should of been hunting shorts, yesterday was positioned to go up but it just shot up in to liquidity if you checked the daily chart and saw that the body of the candle could not close above the 1.3520 level should have confirmed that price wasn't going to reach higher (i was expecting price to got o the .3580) and you can go back to shorting at the 1.3520 level which has worked all week. Hope that helps
kongzz said:was expecting a deeper retracement though
retracement up?
I was also expecting that, I wanted an oportunity to buy (and then sell) and i found it. I was afraid to sell without a retracement. I made all the tools give me that, wich i know is wrong. Even if i was searching for short, i would've missed that. I find a hard time figuring out how much the price will retrace...
Attachments
brians1128 said:market structure was bearish so you should of been hunting shorts, yesterday was positioned to go up but it just shot up in to liquidity if you checked the daily chart and saw that the body of the candle could not close above the 1.3520 level should have confirmed that price wasn't going to reach higher (i was expecting price to got o the .3580) and you can go back to shorting at the 1.3520 level which has worked all week. Hope that helps
Was checking my daily chart and funny thing happened ...did not have that level, that lonely candle where it came ...just was not paying attention. Every level counts
Skipper said:Was checking my daily chart and funny thing happened ...did not have that level, that lonely candle where it came ...just was not paying attention. Every level counts
you can see on the 4hr chart that in the past, around that level of equilibrium, alot of things happened
now my eyes are on the .3450 level
brians1128
Well-Known Member
Skipper said:Was checking my daily chart and funny thing happened ...did not have that level, that lonely candle where it came ...just was not paying attention. Every level counts
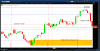
yea i know, happens to me too when you miss a level and after your like damn it was right in front of my eyes. i keep different time frames set up differently but hopefully this helps to show how the .20 level was important
Attachments
brians1128
Well-Known Member
brians1128
Well-Known Member
sure because that brought up talks of sooner rather then later tapering. it fuels the move to the downside but still doesn't change the fact that market structure is bearish and looking for shorts in the fiber should of been the focus not longs and having the news releases this week helped put the cherry on top
brians1128 said:sure because that brought up talks of sooner rather then later tapering. it fuels the move to the downside but still doesn't change the fact that market structure is bearish and looking for shorts in the fiber should of been the focus not longs and having the news releases this week helped put the cherry on top
Meh, it happens can't have 100% symmetry.
I actually went long GBP/USD earlier in the week after being burned on Sun/Mon going short.
To be honest bonds are acting strangely as well
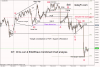
Very detailed chart, combining ICT, Chris Lori & Elliottwave analysis. Why? because these entities know how to trade Forex, that's why have studied all 3 concepts. using the right concept at the right time is key, all 3 concepts see the market from different "goggles" but yet see the same thing! so what are we looking at?
read into this chart for 10 minutes
says sell with RSI divergence, also Stochastic divergence works with corrections, RSI divergence works well when the market is topping or bottoming slowly, forming a consolidated top or bottom, i will create a chart based on this for next time, for anyone who doesn't know what i am talking about
Attachments
Who wants to see just one crazy set up from a daily chart? narrowed down to a 1 hour chart, Boom! price takes off 400 pips into the distance! using 1 tweaked indicator and a Daily POR. This has taken me months to fine tune! now it provides a great framework for "trying" to pick bottoms and tops. it ain't gonna work every time mate, but it does tell you the tide could be about to turn, when the daily chart signals it.
I knew that a bounce was coming, even when Yields where saying otherwise...
So it is possible that this market is poised to take another dive
I knew that a bounce was coming, even when Yields where saying otherwise...
So it is possible that this market is poised to take another dive