
You are using an out of date browser. It may not display this or other websites correctly.
You should upgrade or use an alternative browser.
You should upgrade or use an alternative browser.
Scout Sniper Basic Field Guide - InnerCircleTrader
- Thread starter TheInnerCircleTrader
- Start date

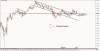
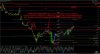
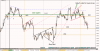
Oil - Daily chart shows reversal candle at institutional level 96.20/96 Big figure, against the dealing range, and against the 79.3 fib.
I think the market may have bottomed. Just wondering what others might be thinking.
I think the market may have bottomed. Just wondering what others might be thinking.
Attachments
It would be nice to see another low form first, but you never knowgoodpunk6 said:Oil - Daily chart shows reversal candle at institutional level 96.20/96 Big figure, against the dealing range, and against the 79.3 fib.
I think the market may have bottomed. Just wondering what others might be thinking.
dekk said:looking at 10 year T Note and 10 year bond yield charts, should we now be bullish on USD or do u think its better to wait for crossover of 9 n 18 EMA to act as confirmation???
Out of curiosity, what do you see in those charts?
ams_trades
Active Member
dekk said:Looking at the bond yield again, i dont think theres too much to read into anything on that at the mo
Hi Dekk,
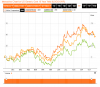
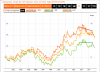
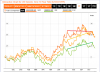
Just using the yield chart you posted up I see a couple of divergences that may prove useful in the coming days / weeks.
First chart you can clearly see GER / UK rallying whilst the dollar fails to make a higher high. In the second chart we can clearly see UK making a higher high with the GER making an equal or slightly higher high, whereas again dollar is struggling to go higher.
Looking at this alone could suggest a rally in foreign currencies and a decline in the dollar?? Just my two cents...
") Anyone else got an opinion?
Anyone else got an opinion?Attachments
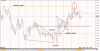
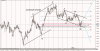
dougl1965 said:Sorry, I haven't been by this site for awhile. Anybody catch the EurUSD short today (4hr chart)?
I had the fib drawn this morning and didn't put my order in.... and "bam bam" just like the Flintstones, it worked.
Had a short at 1.37854.... it got snapped out +1 pip.
dougl1965 said:Sorry, I haven't been by this site for awhile. Anybody catch the EurUSD short today (4hr chart)?
I had the fib drawn this morning and didn't put my order in.... and "bam bam" just like the Flintstones, it worked.
I did. Where it is now.
Attachments
goodpunk6 said:I did. Where it is now.
Nice, like it came up to high five you and you hit it perfectly. Where as when it went to high five me it just stepped on my face to slap my hand.
goodpunk6 said:I did. Where it is now.
So you are the oil trader? nice job on the short....
the 4hr fib chart looked pretty good.
dougl
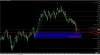
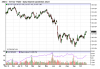
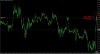
Look How price goes back to the consolidated weekly and monthly open level in this chart, after the stop raid.
Gdayfx also called for lower prices at these levels, refer to link...
http://fxgears.com/forum/index.php/topic,140.msg2011.html#msg2011
USDJPY Long http://fxgears.com/forum/index.php/topic,140.msg2063.html#msg2063
Gdayfx also called for lower prices at these levels, refer to link...
http://fxgears.com/forum/index.php/topic,140.msg2011.html#msg2011
USDJPY Long http://fxgears.com/forum/index.php/topic,140.msg2063.html#msg2063
Attachments
dougl1965 said:So you are the oil trader? nice job on the short....
the 4hr fib chart looked pretty good.
dougl
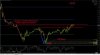
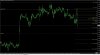
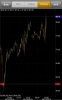
Yes. I trade Oil futures. I've attached a pic of a short term trade I have going in Oil right now.
Attachments
goodpunk6 said:took profits at +10 and +49. Last bit is still out there. Whether my TP hits or not, I'm happy with what I got.
Target Hit.