
You are using an out of date browser. It may not display this or other websites correctly.
You should upgrade or use an alternative browser.
You should upgrade or use an alternative browser.
Scout Sniper Basic Field Guide - InnerCircleTrader
- Thread starter TheInnerCircleTrader
- Start date

P
Piper
Guest
kongzz said:Was looking at the EUR and a ICT moment came to me...
"Its too clean"
lol, i think price will clear stops above the 1.3320 level, to form a turtle soup entry @ 1.33450 level(previous months high) we shall see i guess ...
Just wondering..Why would it go up to 1.3345 in your opinion?Or if it will,why would it stop there?(kk i'm a bit biased here,cause went short at 1.3310 second high swing
") ) so i really do wonder.
) so i really do wonder.My opinion is anyways:


Too much attachments..But darn if i started i'll finish this lol,promise,never again >
Disclaimer:not trying to give you a trade,and these are my 2 cents,use this info with caution and this been posted for the sake of argument only.
kongzz said:"Its too clean"
Also there's a core rule,what Jack posted in my journal and really did bring me back to my previous successful zen trading track(what somehow i did forgot.When you are a too successful neophyte, that could turn into a great pitfall of assumptions,what you are taking for granted,and it f***'s u up,and also your trading):
"Trade what you see and is out there,not what you assume."
-Jack
If this will be rendered invalid,then i'll reevaluate ???
GLGT
Hi Folks,
Thought I might add my thoughts to this, take these with a pinch of salt as i am still rubbish at this. Looking at the daily chart there seems to be some upward pressure, should this continue price would move into the daily OTE area with the 70.5% falling directly on the mid figure. There could also be stops at the 1.3400!, assuming it does go up I have pulled the fibs down from the 79% level to the swing point on the 1 hour chart, this gives an OTE on an open spaced leg at the 1.3200. So my take for the week ahead is up to at least 1.3350 this may start with a gap up later today then down to 1.3200 for the rest of the week. Beginning to think I shouldn't post this. Anyway if you think this is complete garbage let me know, I need to learn so another view would be good.
Thought I might add my thoughts to this, take these with a pinch of salt as i am still rubbish at this. Looking at the daily chart there seems to be some upward pressure, should this continue price would move into the daily OTE area with the 70.5% falling directly on the mid figure. There could also be stops at the 1.3400!, assuming it does go up I have pulled the fibs down from the 79% level to the swing point on the 1 hour chart, this gives an OTE on an open spaced leg at the 1.3200. So my take for the week ahead is up to at least 1.3350 this may start with a gap up later today then down to 1.3200 for the rest of the week. Beginning to think I shouldn't post this. Anyway if you think this is complete garbage let me know, I need to learn so another view would be good.
Attachments
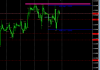
Sorry for the slow reply and the vague post.
Heres what i am anticipating for the week.
I noted the break in market structure you mentioned on the hourly, however my opinion is it
is still trading within the Tuesday's low to Wednesday's high swing and i see it as just a retest of the OTE. or rather just another SnD market profile day.
I think this week will be interesting though given the range consolidation of over the last few days.
On the Monthly chart, im taking note of a previous monthly high at 1.3340+ level which coincides with a monthly 62% fib level.
Down to the weekly, noting the fact that friday was a whip saw day, surging up and down but finally closing off at a significant S/R level, a previous Weekly low.
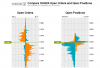
Taking a look at retail positioning, people are extremely net short with alot of shorts accumulated recently which makes it important to pinpoint areas where stops are resting.
Given the consolidation from last tuesday to friday, im looking for a move up first to clear the stops, forming a turtle soup pattern with confluence of monthly resistance/HTF fibs and a HTF SMT forming between the GBP and EU.
Do note that i may probably be wrong, but this is just one scenario i am anticipating.
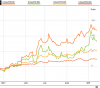
The reason for my short bias is 1) market structure broken on the HTF, 2) Yield divergence can be seen amongst the US treausury yields with 2/5/10 making higher highs and 30s making lower highs. In addition, USDX has recently traded into a major support level @ 81.30 which coincides with a HTF Fibonacci
Heres what i am anticipating for the week.
I noted the break in market structure you mentioned on the hourly, however my opinion is it
is still trading within the Tuesday's low to Wednesday's high swing and i see it as just a retest of the OTE. or rather just another SnD market profile day.
I think this week will be interesting though given the range consolidation of over the last few days.
On the Monthly chart, im taking note of a previous monthly high at 1.3340+ level which coincides with a monthly 62% fib level.
Down to the weekly, noting the fact that friday was a whip saw day, surging up and down but finally closing off at a significant S/R level, a previous Weekly low.
Taking a look at retail positioning, people are extremely net short with alot of shorts accumulated recently which makes it important to pinpoint areas where stops are resting.
Given the consolidation from last tuesday to friday, im looking for a move up first to clear the stops, forming a turtle soup pattern with confluence of monthly resistance/HTF fibs and a HTF SMT forming between the GBP and EU.
Do note that i may probably be wrong, but this is just one scenario i am anticipating.
The reason for my short bias is 1) market structure broken on the HTF, 2) Yield divergence can be seen amongst the US treausury yields with 2/5/10 making higher highs and 30s making lower highs. In addition, USDX has recently traded into a major support level @ 81.30 which coincides with a HTF Fibonacci
Attachments
P
Piper
Guest
Where did u found that DX? Me want too! )
)http://online.wsj.com/article/SB10001424127887323981304579077442028100408.html
Summers backed down for the Fed chair. This adds a lot of uncertainty to the USD since everyone was betting he'd be named.
The reaction in USD based pairs has and will be a bit whacked out tonight/today.. Keep this in mind when lining up trading levels.
EDIT: It probably doesn't matter that much outside of the opening gap. Ignore.
P
Piper
Guest
Holy mother of opening gaps!!!
Piper said:Where did u found that DX? Me want too!
were u referring to me?
if so, thats AVAFX meta trader platform.. pretty much has all the instruments..
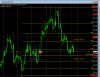
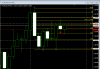
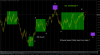
Was flipping through the charts and the USD/JPY pair caught my eyes.
As noted in the chart, market structure broken with a swing high formed.
Watching a high to be formed today or tmr in the box for a short.
coupled with net long commercials on yen, could be a potential swing trade.
thought i'd share.
As noted in the chart, market structure broken with a swing high formed.
Watching a high to be formed today or tmr in the box for a short.
coupled with net long commercials on yen, could be a potential swing trade.
thought i'd share.
Attachments
brians1128
Well-Known Member
nice kongz i was seeing the cot data on this pair yesterday does look like yen is gonna rally
The net longs in JPY futures have been there since Nov 2012 ... Have been beaten many times by JPYs and net longs... Just be cautious here.
... Have been beaten many times by JPYs and net longs... Just be cautious here.kongzz said:Was flipping through the charts and the USD/JPY pair caught my eyes.
As noted in the chart, market structure broken with a swing high formed.
Watching a high to be formed today or tmr in the box for a short.
coupled with net long commercials on yen, could be a potential swing trade.
thought i'd share.
Re: ICT Buy model H4
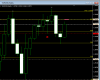
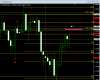
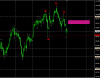
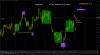
Gday, what are you highlighting in the pink boxes and why?
Cheers
F
GdayFx said:Im not to sure if this low will hold coming out of Asia
Gday, what are you highlighting in the pink boxes and why?
Cheers
F

Re: ICT Buy model H4
Pink boxes represent previous highs or lows taken out
Pink boxes represent previous highs or lows taken out
foreigner said:Gday, what are you highlighting in the pink boxes and why?
Cheers
F
There is plenty going on here I'm sure for that. Maybe I have some things right here? Take it easy with me, really want to learn this and looking forward the next episode
Maybe a larger sell model? You have smaller models inside boxes. I remember that ICT told these sell/buy models are universal and can be found in any time frame. At the moment there is a another consolidation forming lower this old support.

Maybe a larger sell model? You have smaller models inside boxes. I remember that ICT told these sell/buy models are universal and can be found in any time frame. At the moment there is a another consolidation forming lower this old support.