P
Piper
Guest
ICT high probability price patterns. Tansen is still sharing a torrent file on 4shared with all the ICT vids. The torrent worths its price in gold!!
Piper said:ICT high probability price patterns. Clark is still sharing a torrent file on 4shared with all the ICT vids. The torrent worths its price in gold!!
 heh (no worries, I know what you meant))
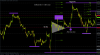
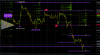
kongzz said:Trying longs at the 1.33450 level which was last months high.
Looking at the daily weekly and monthly, structure and flow still seems bullish to me
Also retail traders are extremely short both the EUR and GBP. So to highlight the trade reasons:
1) Bullish market flow and structure on the higher time frame'
2) major S/R level
3) ICT Stinger/Holy Grail setup
4) Possible Weekly low formed yesterday?
5) Very bearish sentiment by retail.
6) SMT Divergence.
7)Pivot Buy zone
8) Market structure broken on USDX so short on retracement at major S/R 81.50 level + ICT Stinger sell signal
let me know what you guys think!
-Ivan
*Updated stops moved from -30 pips to -20 pips at break of previous hour high.
*Updated2 50% off at +20pips, stops tighted to -10 pips.
Piper said:Lol got a point.. But in this case u can translate the megabytes to kg's, not oz's..
https://thepiratebay.sx/torrent/8039253/ICT
brians1128 said:nope piper .exe file i will run it on pc
thanks for the help man
ArtificialTrader said:What is the ICT stinger / holy grail? Could somebody explain or direct me to a video?
Piper said:Mmm what do i think?
Probably ur up to a kind of surprise.. But who knows..
Tansen said:Actually not to sound prudish I don't think Clark Seeds the torrent anymore after the first few got them.
I was the one who uploaded the torrent to 4shared that I know for sure because I shared it with the late comers of BP and people kept badgering me for it
foreigner said:Yes but what am I looking at specifically? can you give one example to study?


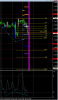
 This is not a SMA or Stochastic. It is real money being moved around by the commercials. You can set bar chart up this way to get a visual presentation on this data: http://www.barchart.com/chart.php?sym=E6U13&style=technical&template=&p=WN&d=L&sd=&ed=&size=M&log=0&t=CANDLE&v=1&g=1&evnt=1&late=1&o1=&o2=&o3=&sh=100&indicators=COTLC%2813369344%2C26112%2C153%29&chartindicator_2_code=COTLC&chartindicator_2_param_0=13369344&chartindicator_2_param_1=26112&chartindicator_2_param_2=153&addindicator=&submitted=1&fpage=&txtDate=
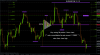
The anticipated price level is now tagged and the MMP sell model is now complete. Watching similar price action and thanks to ICT for the insights!jinirav75 said:So now we have MS in our favour too! In anticipation of this price action I sold Euro @ 1.3387 and aiming to close around 1.3230 level and IMHO this is the price level MMP sell model started it's operation. Thoughts?
jinirav75 said:The anticipated price level is now tagged and the MMP sell model is now complete. Watching similar price action and thanks to ICT for the insights!
foreigner said:Sybrand I cant thank you enough for taking the time to explain your insights on the COT.
I can clearly see the change in net position of an instrument which is reflected on the line chart.
However, I cant see what you mean by money flowing between currencies, or, how you determine if they are positioning prior to taking profits, could you give me an example of this?
Many Thanks
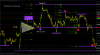
Thank you. Hopefully we should see this level soon (the previous sell model did not retrace to a level it was supposed to though).Sybrand said:Below 1.32 will be the end of the mmp
foreigner said:Sybrand I cant thank you enough for taking the time to explain your insights on the COT.
I can clearly see the change in net position of an instrument which is reflected on the line chart.
However, I cant see what you mean by money flowing between currencies, or, how you determine if they are positioning prior to taking profits, could you give me an example of this?
Many Thanks