

goodpunk6 said:Another good setup! Thanks ICT. http://killingitictstyle.blogspot.com/2014/02/13680-and-weekly-trinity-breakout.html
Ive heard of trinity dont know how to apply it in this way can you explain?
Cheers
F
goodpunk6 said:Another good setup! Thanks ICT. http://killingitictstyle.blogspot.com/2014/02/13680-and-weekly-trinity-breakout.html
cskrishna said:Hello All,
Quick question.
I watched ICT’s Jan 15th webinar where he explains the way stop raids happen. There he talks about how the “highs are clean”, where the stops reside. After the stop raid happen, I can see how the false breakout and then the price goes in the opposite direction. I understand that but I could not understand the concept of “clean highs” where the stops reside. Can someone please let me know how to identify this kind of highs/lows?
Thank you so much for all your help.
Tansen said:I didn't see it, but clean highs are usually something that just means if you were to draw a line through there and you could potentially guess that "IF" this place is raided or if price goes back to you can expect a bounce but instead it just goes through it to take out the people who were collecting positions there and after their stops get popped they run it the other way knowing that they just grabbed some liquidity from their stops getting triggered.
I'd have to watch the video later to confirm this though... I'm just going off what I remember and the times I've seen him say these highs are too clean.
Kuzia said:Lazy to draw pictures but If u look at week of 3d of February on Fiber you will see lots of stops and they are kinda not far from each other so it looks like "clean" stops and Thursday they were cleaned by the cleaners that what means clean stops, as well check out stops on Cable for this week u can see 3 stops at 1.6735 so I would consider them "clean".
As well this weeks Fiber level 1.3700 looks clean
sqa said:Anyone else finding, via ICT methods, that they just "see" moves coming? So far it's only on my main pair (USDJPY), but once I get a feel for the market the pair is inside, it makes a lot of sense what is going on.
The flip side problem I'm having to work through is being very accurate with my Entrance/Exit. I've gotten nailed on a bunch of Judas Swings lately.
This is my take on it:GdayFx said:Pulling out some ICT technical tools, is there more upside?
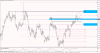
Hopiplaka said:This is my take on it:
Market Maker Buy program completed on the 4H
Failure Swing on the 1H
Divergence in stock market, some failed to make Higher High
Bonds bounced off off the OTE zone and continue to go higher=lower yields=lower foreign currency prices.
So I'm bearish today. I'm considering 1.3760 to be a resistance point, TP 1.3535-1.3560 level (might not come this week, maybe early next week?)
TopFroxx said:with you
Nice trade PipPimp!PipPimp said:
Kuzia said:Sorry guys im joining bulls today. I think that swing down in fiber was judas.
Kuzia said:Sorry guys im joining bulls today. I think that swing down in fiber was judas.
")