Here is the vid, i made a new thread for it...
http://fxgears.com/forum/index.php/topic,179.msg2390.html#msg2390
http://fxgears.com/forum/index.php/topic,179.msg2390.html#msg2390
walshman said:I'm in. Would love to see it :thumbsup:
Any thoughts on AUD/NZD? Judas swing or reversal? :-\
Peterma said:Great action today on fibre - I see that the pesky line is now dust (at last).
Chris Lori's market 'inefficiencies' and ICT's swing point and ote area now spring to mind when looking at the 1hr. - but that's for a different day.
GdayFx said:if Kiwi is over valued as some analysts are talking about........
They certainly don't tell you when to pull the trigger, do they mate...shopster said:no such thing as overvalued......
analyst's are paid pencil pushers who don't have a nickel on the line and know jack about the game.
s
Tarri said:So bit confused on EURUSD, bias is sell (9 below 18) however short term market structure is broken to the upside (on daily) and bullish on all TF. Guess this means sit on my hands until it becomes clearer.
Retail traders are short (74%) which is a contra indicator, commercials are slightly net long but could also be volume already going down towards the end of the year.
ICT tells in video not to go bottom or top picking but would be nice to have some sort of indication of tops/botoms in.
Any views?
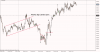
Peterma said:Daily chart, Nov 21 price 3391 - daily bars each side with higher lows. ( I would have liked to have seen the high of the right bar (3356) pierced, but that may come tomorrow).
Run a fib from Fri low to Fri high - check for ote level on that .....3490
Check pivot s1 .... 3490
Low of today .... 3490
Many retail going short because of the stubbornness of 3550-60
weekly pp at 3508 - so I went long there.
Could be an iffy trade - important to stay above today's low during AS and then LO tomorrow - if the trade survives that then all is well for a tp around 3645 (the 100 extn of the fib and a s/r level that I've been looking at as a 'reaching to' level)
On a h4 chart draw a horiz line here to see why.
The danger with this trade are the Asian stops below 3460 - they have to be tempting.
Tarri said:Hi Tansen,
when you say the major structure is not broken you mean we did not take out the ITH at 1.382?
Other than that one all are broken from what I can see. One positive day and 9 will be above 18 as well. It looks like we'll get a retest of the high, confirmation will be breaking the monthly open around 1.358, if it reverses there we'll head lower. Before that the 1.3550 will be key.
So looking ahead if we have an upmove to 1.355 during LO I will be looking for either a reversal (turnaround tuesday) or a break of 1.358 during NYO. This will determine the bearish/bullish outlook for the rest of the week/month.