Re: Price Action Weekly Highlight EURUSD
")
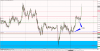
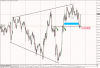
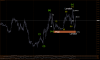
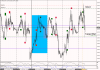
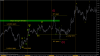
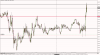
Looks like the 4H MMSM was incorrectHopiplaka said:Also a very nice Market maker sell model in the works, if you're a fan of ICT