ICT Advanced Price Action Trading Concepts

FTMO Trader Scouting
saeedzaman said:
ok....have u understood the trades ive posted so far and how they couldve been taken?

I see it now, and always see it after the fact, but during price moving up I was waiting for it to go a little higher then what it did.

Usually I miss the trades because they don't go to were I thought, or when I am looking for OTE we get a turtle soup, or when looking for turtle soup we keep on running in the same direction or stop at OTE...I am correct some of the time, but not enough to be at least breakeven.
 
what i do if im not sure is wait for that break down in the 5min chart once price reaches the htf zone. maybe enter on demo if u lack confidence and with more trades you take the more your confidence will build up to take them. u gta pull that trigger tho. have u been attending ict live sessions, try and attend next week if possible...they really are gold dust. you learn soo much
 
with that turtle soup, i waited till price broke down and then took the trade, so htf setup was in order and then confirmation on lower time. with that your risk is really small to.
 
still studying them... go back and fourth over the concepts. wanted to see if i can execute them accurately, as if i had a real account
 
saeedzaman said:
have u been attending ict live sessions, try and attend next week if possible...they really are gold dust. you learn soo much

Wish I could, but I work long hours at my day job. If he would hold them during London Open I could attend, but nope they have to be at NYO all the time.
 
PipHanger said:
Wish I could, but I work long hours at my day job. If he would hold them during London Open I could attend, but nope they have to be at NYO all the time.
cant really accomodate everyone lol
 
PipHanger said:
Here is an e-mail I sent to ICT for clarification on S&R Levels. Maybe someone else could help with this...

One thing I have had a hard time understanding and still am confused about is Support & Resistance. I know with your last market analysis video I keep saying you had like 50 lines on each chart and you are saying to use these when price reaches them and use your tools and time of day to get into the trade.


To me it seems like there are so many false signals where price goes through levels, it might stop at a level or during one session (LO) price might go through two or more levels before stopping. I am more confused then ever on how to utilize this. I know you keep asking to study price, but I just am not getting it no matter how much I study it. Why is it so confusing?


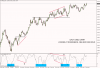
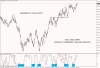
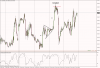
Here is what I am talking about...This is an image of the gbpusd daily chart. I have marked out monthly and weekly swing highs and lows, plus order blocks. As you can see with the Blue X's we have price within OTE's at a S&R level, but they failed. If you look at the green checkmark's you can see we have a stop raid or OTE in no man's land but these are the ideal places to get in. I know it's because of experience, but somehow you can read through these and are getting in at these marks to run price back through a level. To me it doesn't seem like S&R helps out but makes it harder to understand the direction of price movement. If you entered at any checkmark you would be entering before a major resistance level?

PipHanger - Look at these two Daily charts on cable, study them closely with the indicator. tell me honestly, does it help you see price in a better way when it comes to being over sold or over bought? give me an honest answer.... people are different in the way they see things from what i can gather. You posted a daily chart, so i used the same time frame for you. You need to get a feel for what is or about to happen in price.
 

Attachments

  • gbpusddailyexample.png
    gbpusddailyexample.png
    26.9 KB · Views: 99
  • gbpusddailyexample 2.png
    gbpusddailyexample 2.png
    25.5 KB · Views: 78
have been studying some price action this Sunday night. Because that's all i ever do Lol :p
look at this OIL chart, there was a sell signal in the 4 hour chart, dropped down to a 30min chart, London sell off. The key signal here was not only the divergence in the 4 hour chart, But! the equal leg up movement, that took place before the sell off occurred. that's just one type of price development before it happened. there are more types of market language that we need to learn and know what is about to take place.
Somebody show me the 4 hour divergence chart set up?

Oil could make some crazy moves this year
 

Attachments

  • usoilm30.png
    usoilm30.png
    26.7 KB · Views: 54
if you feel down and feel things aint good at the moment in your trading or life in general dont give up

https://www.youtube.com/watch?v=hV63DbQ_qSc

watch this hope you all like it:D
 
GdayFx said:
This is what we didnt look at, also i am thinking price could extend lower
before closing the gap, could be wrong, its only a thought!
Need to see what takes place, also i am not forgetting what yields have been doing...

sharing this view. think we will most likely see both the high and low of last week taken, collecting liquidity after an illiquid week. more likely to see a move lower first. long at monday NYO or tuesday LO to target the gap would be my likely course of action

edit: obviously skip monday. so potential long at tuesday NYO or wednesday LO.
 
GdayFx said:
PipHanger - Look at these two Daily charts on cable, study them closely with the indicator. tell me honestly, does it help you see price in a better way when it comes to being over sold or over bought? give me an honest answer.... people are different in the way they see things from what i can gather. You posted a daily chart, so i used the same time frame for you. You need to get a feel for what is or about to happen in price.

Yes they do, but yet it produces so many false signals it's not even funny. Also if you are correct, trying to get an entry with a decent stop would most likely cause you to be stopped out many times before price went in the direction you thought it would.

Also I have seen many times where price will be going up with Over Bought being in that zone for many weeks at a time, while price continues to climb higher.
 
http://theinnercircletrader.com/tutorials/Precision_Trading_Vol_1.mp4
http://theinnercircletrader.com/tutorials/Precision_Trading_Vol_2.mp4
http://theinnercircletrader.com/tutorials/Precision_Trading_Vol_3.mp4

For those with Firefox or another browser that doesn't like shortened links.
 
sqa said:
http://theinnercircletrader.com/tutorials/Precision_Trading_Vol_1.mp4
http://theinnercircletrader.com/tutorials/Precision_Trading_Vol_2.mp4
http://theinnercircletrader.com/tutorials/Precision_Trading_Vol_3.mp4

For those with Firefox or another browser that doesn't like shortened links.

thanks a lot for posting these links up !!! :) :thumbsup:
 
FTMO Trader Scouting
Back
Top