ICT Advanced Price Action Trading Concepts

FTMO Trader Scouting
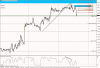
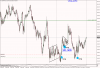
ICT watches the USDX pretty obsessively, even if he doesn't trade it.

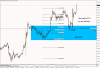
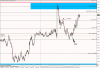
Though for the GBPUSD, I'd take the guess that after the NFP dead-cat bouncing, he went searching for the market move being setup. As he posted on Twitter, the USDX & GBP Futures were diverging the entire week leading up to NFP, then really nothing at NFP. It meant the move was being engineered.

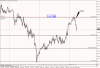
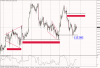
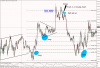
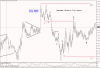
Though there is definitely a fine art to it. I trade USDJPY and, but for 1 week, I've been good at knowing where it's going far too well. I just suck terribly at getting into the trades properly. So there's most definitely an "art" part of it. I wish I could give advice on the topic, but I'm simply not far enough in to assure of much of anything.
 
PipHanger said:
There is ALWAYS two sides to every coin. ICT's tools line up on the wrong side of trades just as well on the right side of the trade, but the tools aren't shit without a directional bias.

This is what confuses me the most. Every week I go in stalking a trade setup that lines up perfectly only to see it fail over and over again. It's very unlikely that I catch the correct side and if I do it's probably more of luck then anything.

What direction does price take, before it changes direction, where does price want to get to? Block, fib, institutional level, time, confluence all need to be lining up
 
ICT's Gold trade, confluence within the fibs, Daily block & FOMC, who knows where the FIFTY fib came in, that i added into the chart? big guns made that fifty level a while back
 

Attachments

  • gold.png
    gold.png
    23.2 KB · Views: 257
Look at this week for example...Price opened for the week and has continued to go higher, higher, and higher. What have we been learning from ICT?

Price goes above open (Judas) for selling into Tuesday or Wednesday London Open for the high of the week.

Price goes below open (Judas) for buying into Tuesday or Wednesday London Open for the low of the week.

We even had price run into OTE's using previous weeks swing highs.

If I would have know price was going to be up this far, it would have been a piece of cake getting longs using lower time frame Fibs, Levels, and Blocks, but for some reason I can't get the Bias correct.

GdayFx said:
What direction does price take, before it changes direction, where does price want to get to? Block, fib, institutional level, time, confluence all need to be lining up
 
Ok so you where looking to sell Fiber right? Fiber is not ready to sell yet, as far as the higher time frame charts are telling us. look at the monthly chart, all green! savy traders will be able to sell Fiber, though if you caught a sell, you wouldnt hold it for very long id say. There is a Monthly block candle top side, that has not been reached, will it reach it? i wouldnt have a clue! though the Bias for Fiber is Long at this present time, even though market structure broke, fiber soon told the real story for now. we need longer term set ups to develop also eyeing USDX. when you get hit! get back up with new knowledge
 
I am short EURJPY @ 141.406 with sell bias atm, looking for sell set ups only for now, looking at 140.00 with any luck, see what this market tells us in the coming days. If the monthly low is already in place, this theory will be blown out of the water.
So far we have neither broken last months high or low this month
 

Attachments

  • 04 10 14.png
    04 10 14.png
    23.3 KB · Views: 50
Aussie/Yen has been banging the Daily block, good employment reads today, could be a fake rally? wondering if this pair is setting up for reversal :-\
 
"if only I knew in advance which way the market was going, I'd be rich!"

well you and everyone else Piphanger!!

I just can't understand this entitlement complex you suffer from that makes you think that the market owes you money. Wake up bud, the market is trying to take your money every chance you give it. If you don't have something that you can trust.... why are you even trading with it???

You think you're proving that ICT is wrong, but all you're really proving is that you're too stubborn (or lazy?) to go find another method of trading.
 
I hit the clean lines area and took profit, from the second trade today.
In EW, ICT's Clean lines represent the 4 region, so buying a pull back shoots you into this region to take out any stops that lye above 4
i made this chart myself, to explain it in price action patterns, the RED line is Clean Lines
 

Attachments

  • example ew clean lines.bmp
    960.1 KB · Views: 91
  • audjpym5 40 pips.png
    audjpym5 40 pips.png
    22.7 KB · Views: 239
What do the Black lines & red boxes represent?
If you cannot answer this, you are not permitted to be in this thread yet!
Go back to the Sniper series
GdayFx is hunting this pair...
 

Attachments

  • example.png
    example.png
    30.7 KB · Views: 102
GdayFx said:
What do the Black lines & red boxes represent?
If you cannot answer this, you are not permitted to be in this thread yet!
Go back to the Sniper series
GdayFx is hunting this pair...
The black lines are the top of the order block (last bear candle before the up move) or bottom of the order block (last bullish candle before down move)
The red boxes are the OTE levels which reside in the order block
 
PipHanger said:
There is ALWAYS two sides to every coin. ICT's tools line up on the wrong side of trades just as well on the right side of the trade, but the tools aren't shit without a directional bias.

This is what confuses me the most. Every week I go in stalking a trade setup that lines up perfectly only to see it fail over and over again. It's very unlikely that I catch the correct side and if I do it's probably more of luck then anything.

You have a very good point and if for example you were to follow the daily moving average cross bias on Fibre you would have had one trade in the last month, and thats if youre lucky!

Clearly theres more to it, and the daily moving average is fine in a trending market but about as useful as a chocolate tea pot in current market conditions.

My advice is take ICT concepts and learn to apply them in different market conditions with strict rules to keep you on the right side.
 
Hopiplaka said:
The black lines are the top of the order block (last bear candle before the up move) or bottom of the order block (last bullish candle before down move)
The red boxes are the OTE levels which reside in the order block

good point about the fib levels, though the red boxes represent liquidity in this case
 
Its a long day for me in Aus, landed 2 Yen trades today, now short Fiber @ 9.30pm Australian time, waiting for the NY open then going to bed!
 

Attachments

  • 04 11 14.png
    04 11 14.png
    29.8 KB · Views: 53
1 day, 1 pair, 3 trades + 80 pips, volatility can be traded...
 

Attachments

  • usdjpy 04 12 14.png
    usdjpy 04 12 14.png
    24.8 KB · Views: 58
sqa said:
I'd call that a Good Day.

The 3 way movement, ie the second trade i took, could have been sold easily, after price legged up nearly equally into institutional level,with a consolidated triangle in the middle.
I am not sure where it could be heading yet, short term
 

Attachments

  • usdjpy 04 12 14 2.png
    usdjpy 04 12 14 2.png
    32.1 KB · Views: 239
  • usdjpy 04 12 14 3.png
    usdjpy 04 12 14 3.png
    71.9 KB · Views: 49
FTMO Trader Scouting
Back
Top