
You are using an out of date browser. It may not display this or other websites correctly.
You should upgrade or use an alternative browser.
You should upgrade or use an alternative browser.
ICT Advanced Price Action Trading Concepts
- Thread starter TheInnerCircleTrader
- Start date

marcusmcneice
Member
ICT- In regards to the Homework Assignment on Fib Order Block Concept and Pivots. Is there a preference on which timeframe to compute the pivots (midnight to midnight EST, midnight to midnight GMT)?
marcusmcneice said:ICT- In regards to the Homework Assignment on Fib Order Block Concept and Pivots. Is there a preference on which timeframe to compute the pivots (midnight to midnight EST, midnight to midnight GMT)?
If your talking about the pivot indicator that plots I think it was like 5 lines, it's based on your broker's local time so for instance I could be in Iceland but my broker is Oanda Canada in Toronto, Ontario. I would set my pivot indicator to be GMT -5 (Make sure you account for Daylight savings times as well)
marcusmcneice
Member
Thanks Tansen, I guess I am asking is there a specific time to use to compute the pivots. I assume you have a EST based broker if you are using -5, so you would be computing the pivots using midnight to midnight GMT time.
Is there a preference with using Midnight GMT or Midnight EST, they would be different slightly. I guess it might come down to which session you are trading in (London Session or NY session).
Is there a preference with using Midnight GMT or Midnight EST, they would be different slightly. I guess it might come down to which session you are trading in (London Session or NY session).
marcusmcneice said:Thanks Tansen, I guess I am asking is there a specific time to use to compute the pivots. I assume you have a EST based broker if you are using -5, so you would be computing the pivots using midnight to midnight GMT time.
Is there a preference with using Midnight GMT or Midnight EST, they would be different slightly. I guess it might come down to which session you are trading in (London Session or NY session).
I haven't used that indicator in like forever but yes I am EST and there would be a large difference in the drawing between GMT and EST again I haven't used it in forever but I believe the way it was programmed is that you need to set it to your broker time so it knows where to start drawing the daily pivot, but don't quote me on this until someone who uses it actively confirms this.
rod178
Well-Known Member
http://fxgears.com/forum/index.php/topic,242.msg3828/topicseen.html#new
"... I've often found that "NY Close" pivots are the most indicative, at least for daily pivots used for trading the Asian and London Session.
My rationale is that a new day begins after NY Close.... "
"... I've often found that "NY Close" pivots are the most indicative, at least for daily pivots used for trading the Asian and London Session.
My rationale is that a new day begins after NY Close.... "
In response to ICT's Aussie outlook from latest video
&
this trade snapped back like a spring! off the H4 Block
https://twitter.com/Dan_BuchananGFX/status/446970659344625664/photo/1
&
this trade snapped back like a spring! off the H4 Block
https://twitter.com/Dan_BuchananGFX/status/446970659344625664/photo/1
Attachments
EURUSD blocks
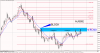
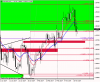
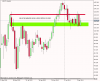
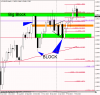
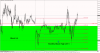
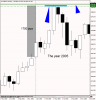
if everyone is seeing Dollar strength, then naturally they feel EURUSD will fall, i am thinking if EURUSD finds a bottom next week or the next, the snap back to the upside will be fast and strong, before we see any more weakness in EURUSD. Fiber could rally very strong towards the highs again, and if it did, maybe even break the last high. anything is possible
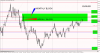
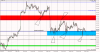
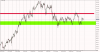
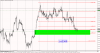
There is a weekly block high below @ 137.155 which is just below a fifty fib and a Sweet Spot on the higher time frame, look at the Zoomed in weekly chart also here.
next level down would be 1.36200 on a sweet spot (are we still buyers)
also have referenced in red shadding, how price used that weekly block low as S&R through the consolidation, to me price was behaving/reacting around those 2 weekly candles that are arrowed in Blue, look closely, this little zoomed in weekly chart, tells a big story
if everyone is seeing Dollar strength, then naturally they feel EURUSD will fall, i am thinking if EURUSD finds a bottom next week or the next, the snap back to the upside will be fast and strong, before we see any more weakness in EURUSD. Fiber could rally very strong towards the highs again, and if it did, maybe even break the last high. anything is possible
There is a weekly block high below @ 137.155 which is just below a fifty fib and a Sweet Spot on the higher time frame, look at the Zoomed in weekly chart also here.
next level down would be 1.36200 on a sweet spot (are we still buyers)
also have referenced in red shadding, how price used that weekly block low as S&R through the consolidation, to me price was behaving/reacting around those 2 weekly candles that are arrowed in Blue, look closely, this little zoomed in weekly chart, tells a big story
Attachments
GdayFx said:EURUSD blocks
if everyone is seeing Dollar strength, then naturally they feel EURUSD will fall, i am thinking if EURUSD finds a bottom next week or the next, the snap back to the upside will be fast and strong, before we see any more weakness in EURUSD. Fiber could rally very strong towards the highs again, and if it did, maybe even break the last high. anything is possible
There is a weekly block high below @ 137.155 which is just below a fifty fib and a Sweet Spot on the higher time frame, look at the Zoomed in weekly chart also here.
next level down would be 1.36200 on a sweet spot (are we still buyers)
also have referenced in red shadding, how price used that weekly block low as S&R through the consolidation, to me price was behaving/reacting around those 2 weekly candles that are arrowed in Blue, look closely, this little zoomed in weekly chart, tells a big story
I agree with you on the push Higher and waiting for those stops on USDX bellow 79.00 to be targeted. Probably 1.3740/20 will be the low of the week.
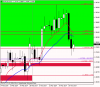
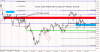
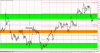
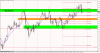
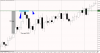
EURJPY likes ICT, as far as i can see in these charts, look closely to reaction areas formed
from weekly blocks, fibs & confluence, its all there
from weekly blocks, fibs & confluence, its all there
Attachments
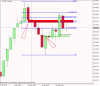
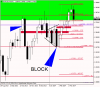
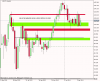
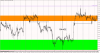
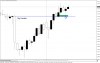
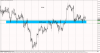
USDJPY - these two charts speak for themselves! this is killer set up material 8)
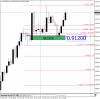
Pop Quiz - can you see the next weekly block below? when dollar yen decides to fall into that area!
The key take away is, when you have a big weekly block candle, price will dance around the high low open and close levels of those candles!!! i always knew big candles made price react, though using the big "block" candles, is what the button man in bank is eyeing off! bull blocks and bear blocks, that's what terms i will be calling them
Attachments
I know we all like to go "great video ICT!" and that type of response, but I think I might make the argument this actually is ICT's best video. Not that it doesn't require having worked through a significant portion of the previous videos to make any sense, but the function of just seeing "why" in real-time & knowing what those levels mean, all rolled into one short video, really is eye-popping.
So, great job ICT, thank you so much & keep up the excellent work. It's appreciated on a level I don't think you know yet. Which is why the haters are the haters.
So, great job ICT, thank you so much & keep up the excellent work. It's appreciated on a level I don't think you know yet. Which is why the haters are the haters.
sqa said:I know we all like to go "great video ICT!" and that type of response, but I think I might make the argument this actually is ICT's best video. Not that it doesn't require having worked through a significant portion of the previous videos to make any sense, but the function of just seeing "why" in real-time & knowing what those levels mean, all rolled into one short video, really is eye-popping.
So, great job ICT, thank you so much & keep up the excellent work. It's appreciated on a level I don't think you know yet. Which is why the haters are the haters.
Its addictive, isn't it
Attachments
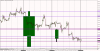
sqa said:The multi-decade aspect of pairs is really fascinating. Certain levels respond almost identically. Most JPY pairs have been in some major regions like that for the last several months.
just noting, I am not attempting to sell AUDJPY at any point soon, looking at this, C wave drives are fast and strong, i have been nailed before trying to sell these type of set ups, lesson learnt
Attachments
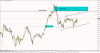
EURAUD dropped 500 pips in two weeks, moving into confluence areas and institutional level, still watching, could head lower longer term in the sell off though. the prior sell off top was all in confluence with 2014 open, institutional, Daily Block, Fib OTE and C wave drop, Boom! 500 pips in 11 days, to break the Feb monthly low from breaking the Feb monthly top first.