jupiter_peak
Well-Known Member
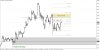
GBPUSD nested OTE short during LO.
AnDDe said:Why would one go short on GU considerding H4 Market flow is up and also the 8/19 emas are up as well on the H4 timeframe. I do see that the Daily emas are still down but seem quite flat.
I wasn't able to spot any short trades only because my framework has changed to the long side.
Tarri said:Personally I expect this won't hold and it will peep for liquidity under the 1.27s. Let's see what it does
jupiter_peak said:I personally think alike. 1.2650 is a nice buy area IMHO.
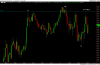
jupiter_peak said:Quite the contrary.
I tend to trade with the big boys. That means that I look at the daily/weekly charts. Long term market structure is bearish and so is trend (EMAS still bearish).
If you look closely enough, today price reached a nice bearish OB on the H4 timeframe. Also, 1.6180 is a weekly resistance and 1.6160 a daily resistance.
For ALL of the above reasons is why I took a planned in advance short during London open today.
Please, refer to my latest video for the explanation.
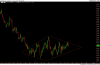
jupiter_peak said:Second chance to sell GU. NY morning session.
jupiter_peak said:Anyone here familiar with the over and under pattern, also know as quasimodo pattern?
This is a very powerfull pattern that happens over and over time. They work really well when trading with the overall trend.
Happened just now in cable during NYO session for a sell.
Tarri said:You mean higher high on price and lower on oscillator i.e. divergence?
jupiter_peak said:No. No oscillator or any indicator.
Pure price action.
Here is a very powerful formation. Check this against the recent price action in GU, just for a sell.
http://www.nobrainertrades.com/2009/06/over-and-under-pattern.html
Nice tradejupiter_peak said:Here you go.
Plain PA.
gacafola said:Price in a possible diamond formation
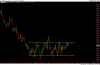
")